Basic usage
Choose SQLite database, CSV file, JSON or NDJSON file
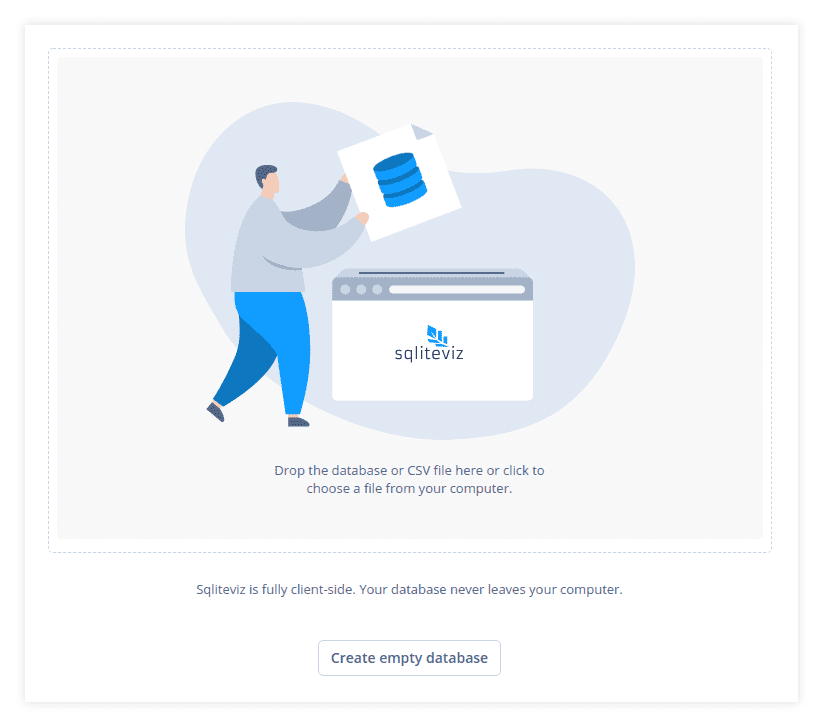
You can choose a database, a CSV file, a JSON or NDJSON file right on the welcom page (fig. 1). The
supported file extentions: .csv, .json, .ndjson, .db,.sqlite and .sqlite3.
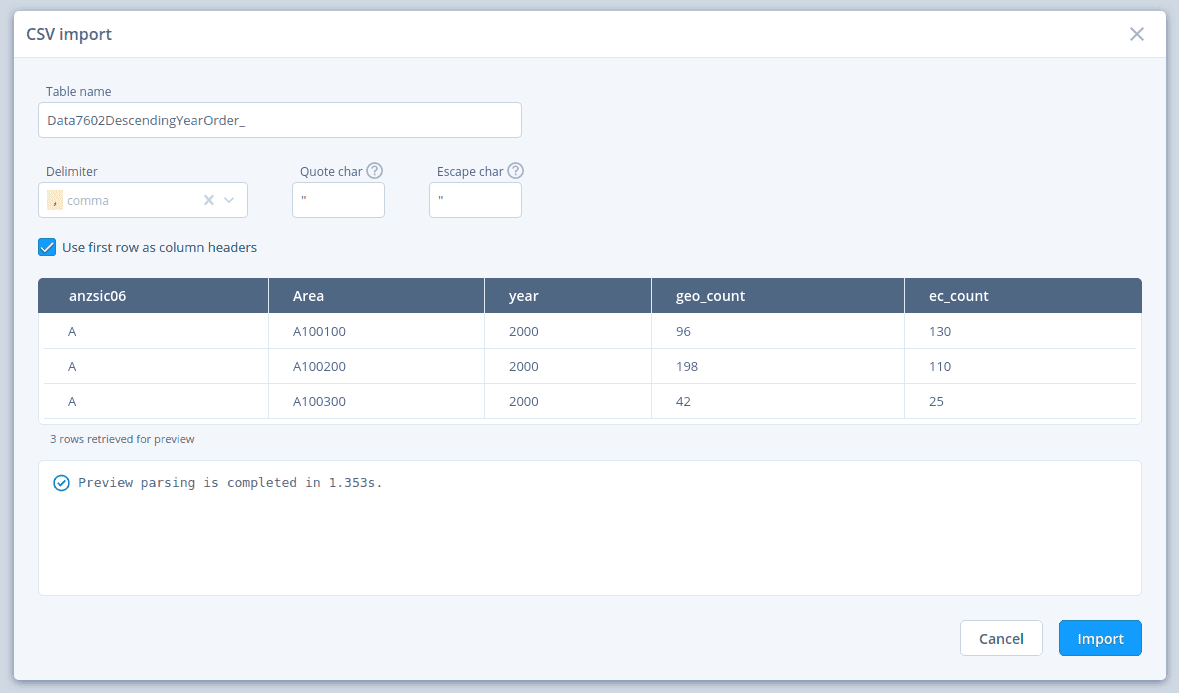
If you choose a CSV, JSON or NDJSON file it will be parsed. Then sqliteviz creates a new database with data from the file. You can change table name in the dialog which is shown automatically if you choose a CSV, JSON or NDJSON file. For CSV you can also change parsing settings (fig. 2).
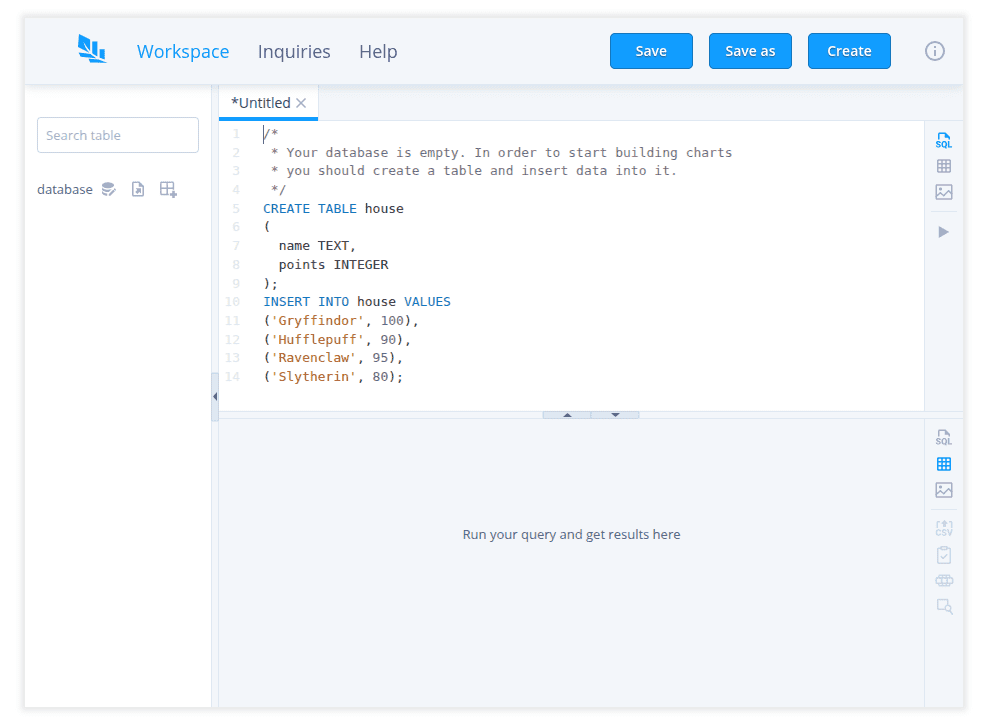
If you don't have a database or CSV or JSON/NDJSON press Create empty database button and
then fill an empty database using DDL and DML statements. A tab with an example
of how to do it will be opened automatically (fig. 3).
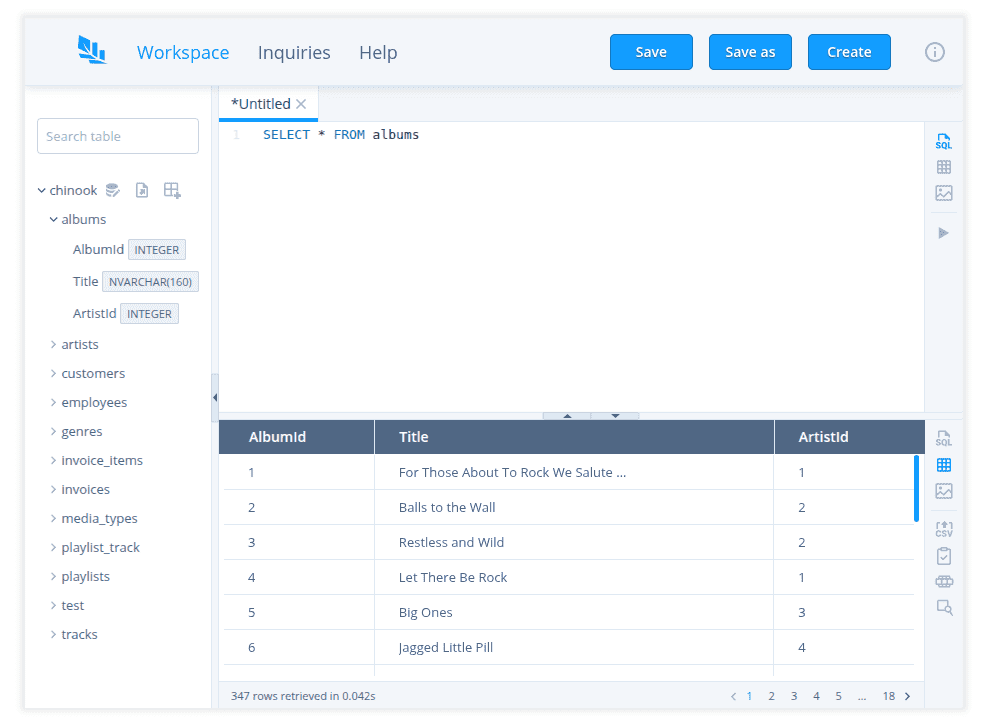
Database tables, columns and their types are shown in the left panel of the
Workspace (fig. 4).
Create inquiry
Open new tab
Press Create button in the top toolbar or use Ctrl+b (Cmd+b for MacOS)
keyboard shortcut to open a new tab for an inquiry. An inquiry consists of three
parts: SQL query, result set (result of the query execution) and visualisation
of the result set. A tab consists of two panels. Each of them can show one of
the three parts of inquiry. By default, the top panel shows SQL query editor and
the bottom panel shows the result set. You can switch any panel to any other
view with the corresponding buttons in the right side toolbar.
' width='18' height='19' xlink:href='data:image/svg%2bxml%3bbase64%2ciVBORw0KGgoAAAANSUhEUgAAAEAAAABECAYAAAAx%2bDPIAAAACXBIWXMAAAsTAAALEwEAmpwYAAAcJElEQVR42u1bB5xU5bUfUIM1YEvsYkmi2LEEjYWgoLEbY0dCVJQmYiMqgmBCUUDKsmV2eu/lTu9zp/fZ2dkp23vfZZe2u2yB8/hmPhLCg4coor737u93fnd2Z%2ba73/3f0/7nnKFQjnEAwL/kp3Cc8v38nwfgOMc4ABgPAKdhOf0kyWmHCVp/3NFu%2bHAwfgxAxlEolF9QKJTzAOBXAHAlAEzGcvV3lEPfRWtdzhD7fn3zjdMvoFAoZ1MolPE/JQDQzZ9BoVB%2bOe6M8VfLHMk7TJGm6cZw40xrrGUmmex6xJPqfcSTzos71fPw/yToM97Mjpm%2bbN9M9Dfhyk7/plT5h3nvrrxrxswXbqRQKJfg6/0kADiNQqGcRaFQ0JOZLDJFfy93VDzLVnveLJXaF9JljkVslWcBl/DOP0FZyCG8C9FrutTx1hYG8fr67eK/FLAMj0Rr998MAJN%2bdADwhc7FKnoHAMxsG4U5rlTvJ3J7xQaBPlQg0IW2iwzRbSLjv0V8FDnyfZExWoBEYo5vlVrKNsks5es07urPI/XDCwHgKQC4CQDORz7iR3OQePHLAWA6AMxrG4VVkfp9VEu0Vakisw6JKe4X6iMhgS4U4muDIZ42GEbn44ouFBLowyGRIRKUmMt8clvSrXJm7MZgoyZUM8joAlgBAC8CwF2JXriSQqGc82MBMA4/iXmJVqAT7iqHxFxWITbFmkSGaA9PE9jNVnoGmHLXAF3mHKRLnUO5s8w5yDhC6IcJQ04OMhWuAbbSs5dL%2bHfxNMGdAl24T2Iua9d6a8vJZI8qUL13jTHU%2bDpXH7i/SGm%2bEpvijwLA7w%2beVxOuSh9VZO0u4puG6TLnfo7ad4CvCwFfGwQu4T/A0wT2HxLuUeS/vU/4DxwSgS4MMks5SMxlaL1BsSmelZjjCg7hW6NyZeYAwN0AcMG3zRdOGiAYgAcOOqQtEnNZdQFHN1bIMwBd6hwQGaNdaldlkyPRmYk2DEfTXeDP9oAPnSvaIVDRDsHDJdUJAfQeOidaDoRCNQNRMtmTMIWaKpWOdCdfG9qvsKdAqI8AS%2bneySH8CZExKncmu9cBwKsAMBUALqZQKBNOJQAoKfkjAFDltmQrVWSFIr5piKP2VWncVbZY46gQADYBwN8BADmv%2bfj87lFkMX5vEQAsxd/5smMMCqINI1qdt7aWpwkcQFrAVnmBpfT0i42xtCncrKvogPWdB2B2WQvc%2b95n267CecIpA%2bBhAGCqyWw3Q04CXero5muDNrktuTXeMrYEAB4DgBvQ08FeG50vPYr8Gr%2bHzlcBwI0AcO9ugOc798NqX3aXVWouQ34AlI4UiI0x4GmCg3JbskbrrdGqycp1XE3wb3p/0x8A4LJTCcBMAOCqyWwfR%2b0Dhpxs42oCBFVsXVkitrzA1nlR4nL6d1geJTqXTJ/xzD3dAAujDSMKuS3ZJbUkQO%2brA52vFtBr5GgFunCCpw1JRMbYPys64DUAuBOB/YP7hMMA4KnJbD%2bX8OcBIPyq7TzD8rWF/OeuvvGG678HxhdSKJSpXfvhnXjjqExuq%2bhEzhDdvM5bC3JbEtgqD3K4nTxtMK5yZlRlLQfWAuRB2JHXhLNPBQBctSvbh2yTISfbeZqAhi5zrOJofC8le%2bBmCoVy5ndYHn3n8nkLl9/bA/ButH5YmdMAcxmoySwo7BUgNEQBaR1b5R3hEv4%2bmbW80hpt04Rqh9b7sntel5gr7v98PeeqHyxtxgA8AgActauyl6X05AHQBnUcwvdPjbd6NlbHid9B/VGqey1X6X%2boB%2bD9cN0QIbMmuyWmeO7mRcYoCq%2b5MCs2xXM%2bAYVIqSWRlVmTap42tFZkjM/tAZgGABf9WAC8jgGY9B0BuI6r9E/vBvggXDukkVnLe5AJKB3p3E3zNMEcEEpnGgh3FYiMMQRKH08TSAj0YYUp1Lx%2bH8BsHCIvwmx1HIVycp3gDwXA%2bRiAP3YDfBiqHdRJLeV96ObRzSL7RyaQjwppIFyVILOWo/CIfMIOoSGaMQYb9Zlu%2bGoY4LVugGmbGcbJ0x97YyKqK/wsAZDlAEgdBkAERIZoThsQEEgD0P%2bQWfA0gSG5LVlnDDbqzOGWdSJDfK7QUPYgri9M%2bDkAkPMBPFXOBywN1w2pZNZkB0qv8%2bofQA5wlEv4/yUctW8MvY/CI/7MHoE%2bXMHXhuR8bWhtpG4YRYfbAODsnzoAKG9AjnMyS%2ba6v20EFvkqd4lExlhtqdi2r0RoHqNJ7INMuaufqXD1M%2bWuvpwoXDsZcnIfU%2bHOOUimwj3MkLs6WQp3Qm6vUHXuz7FIlLn%2b8ucAANrkVaVi67SGvfAmmeym8TSBWBHf2LGdo%2bspFpjaSsXWhlKxtZ4qttYhKRXbGmlSRwdd5uxjyF17GXLXQKnYPkiXOvrl1mS6C4AOAH8%2bHnH6KQCAnNS5FArlMobCcUfrCLzky/Z/JTJEdFSRJVIsMJWVim0hhtzpZcidHobM6c6JnPQxFe4YS%2bnJsJTeBqbC3U0VWfdz1H5EogYaB8AIAHMxafphUmG6zNnJ1QQMbLV3DeGpQgDc9R0BQHZ6sT3Z8lsEci/AomDN3k2mUCPL4K/jmMNNDHu8neooay9xJjqKkNhirTSdr1YssyaNfF04yFZ5a0uE1jEUHVACVdkLPkzIfnUyAXgUAIQKe2ov8silEnsfW%2b21MJWu9SpXZi7m6icKwKEK87mYHN2Iq04v4Cf4NwD4K%2bRjPKLCL2GZuwPgI3e6f5PUUi7hEP4gVWTdjQBQkVmo6IAoZp2/PtkAiBT21IDYFINSsa2frfJamYrvBQAFl71RT%2bBM5LQOY4nXHuQe1%2bHzNTisXYYFacuMyh3wltRa/hVXE1DTpI5mLhEAuTUJqU6I/BAAIDrM0riruhhy136mwtXC14U0XI3/S62/9jWchU08RdUaVKCZHKwfmMUhfO/xdUEqR%2b2LozKbQBceru4DEgDePpk%2bAF0Q8e%2bvzZGWKF8XqhPowgGZLUmTWMo%2bsMbbngUAVMI%2b7xSWqy5kEu57SiTW2SJj9EuxKUbwNIGM3JasatkHYmwyF55MAFBisdRR1sEXm2IaiSnOVpGZFXJHarazomc6VtdzThUAv5027QKG2nMLVWJ7QmyOL5RaEpuFhohCTWZVXQdgHS7QTDyZAFyPStSGQP1Kjtr3FZfwLReb4nOFxugsU7T1Dlw2P/MUmsAFvtrB33G1wQeEhujzfF3wPbbKs0Zijq9t2JuLAL8/3gP5j019i89dgsyAcGVepsscc%2bkyx4tstffhYrHtDo4ufO0wwAUAcMYp6hQjAM5jasOXb6App9Dl5H1stfcZpoL8q8gYmVu/Gx4/6LB/d7wHckIAIE899Z47L129sWTKZ2u23jZ34Yc3/uLsCagIgejneTicncpjPC6mIDW/dBNd9rtY0747uwHuAYApuHF7%2bskE4HACMwGfxx1v7VN4TEA2D3lN/CUOq%2bMo/398h6QEdYFRUgMAV%2bBS9%2b041b0bn%2b/E/7sF2xpKUi7C9PO0Y5Ces3G5/HL8HeQ4URnrftx0uR//PRWr8GRcPj/ryLXQdXDChBzzrTgEo2TpQvz5M442V/Bt1Rt5zos9mV03YAL0N9y8%2bMdBr7oBN0DQ%2bZ8A8AnOuf%2bMwbnsGIVRBMwlH6/YNgUnVGjNTw9u9quDKrvt4I0WHtx8AcozAOAznMQ8i8H%2b1RGmdhbOBlFeMgfv7WMAQHwEFUJ%2bu4FZ8utJV1POQQncieblZ%2bOhhCmGQMOsyl5Y4q/cXaz31xlUzkxI6Uyn1GS2Su2qzKqcmZjSkbbrvHWiaMPYmjGAVw4A3Iad4ulHPP2Lz594%2bS2bacSfQrWD7waq9xRbIs0mtSsbVzoqqlXOVD3hytYQ7kpU8rYoHWmWvaxr1Vi%2bM3wjnks4tMeJmDPMbt4H2y2RNrsh0Gj1V%2b0pSXXCAo03%2b8j6YuZNHL3m4hOKSnguB3nO29Kd8IS/as8iQ6Bhm0AXNpWKbakSobmZJrF3spTuTpbS01EqtrcV8ox1JUJrVGIul8Wa9n8%2bCPB0/SDcim74UGEShSu04Yo2eNLgb1yiJiu3CQ0RI0NOpkuE5g6qyNxPlzp2shSuXobM2VoitGSLBWaPQBcRpDpzGoZY6GTs7RF1/hU2n3ddFX0aptzdWiq2t4iMMbPGU72qSGD4y7J/bLx7u0CCtOQXJwLAGdjeX%2bgBWEEme%2bgSc5meLnMGi/imCprEXi4yRgNaT41D46l28bShRBHf1LSVpWktlTjiSmdGHKkf/qI3z9ymYXM4B6vrzJ0An9jjXQyxMW6gy5yhIr4xVcjTV5dKbBmexl8mNsXCqOlBkzgyxQJLlqP2e52JHuZAvp84azCvXVdTKJQrsQ/6gEz2WGkSx55igXkXXxvyqpyZ9QUc7SsfrdowbQtbdsWJAnAmdkargjUDBqklUc5SuDM0iT1Blzp9YlNM5Ur2bq3aAZ9X98OXzmSPiKsJpAo4%2bp0FHF0PVWyrEOjCGlOoaUt3nspOReaEHdT8dBdIlY5MOUftr6JJHIkSodlLFVlMXI1fQLiyBdZY22ZzuJknsyb9LKW3ia3yNcqtFV57vJMWrB5YFqkbfvmrAuE0lAVjR7k0XDtk46h9gwwZOSC1JAJ6f/3XJSLLa5/8o%2bDeQr7hhAFAzuXJfQAsNZltKJXYh4oFpn6axJ7hEn6bxl1d7E33L9R4qp9Id8NzjYOwyhhutiNzKBFZ%2booE5iZUvRHow7JgzcAndbth5htLlt2A%2bf06W6wjyVb59jHkrn62yhdnq7xypsK1jS51fFTA1b0usZS9mmyHz8hkLyEyxpqYCk8/U%2bFp5Kh8Lh4R5Kid2RU6T%2b3TD8186hZsAksq2sEq1EeGuIR/UEVmg9Zo2waG3PXa8nXUe6li8oQBQKHl2c4DIBHowr1UsQ22MomxEpG1macJeHW%2bOpot1j5/7jsfz/h41dbpewDeahyCokDtgNmZ7CGtsXaTNdYmcad2FGa6YGm0ft8TXMJ7HypgNA8BS%2bFId%2bZbXP5dhKvKaQo3b1aT2SUbSqTPTJ320H1Llm%2b4dxBgTqoLaEpHJslUeLqoImtnscCcpUscTrUzS021w9winv7OQz4g1QE2oSGC2mXDKmcmYo22bWLIXLOXr6PeRxW5rjyhsjjWgKeb94GArfZ2bufqYStLA0UCUx9Sda23Vm4v6/x02cotT910050P1PTDLAB4GYesdwDgLVy9QbWB5yJ1Q4%2brycyzVTvgQ0%2b6Ty/QR3YjAFRktjnbA5whgLfTXTDjnPMm3oBqgg8%2b9gLKJWbsAlhhCDbq2GpfskRoaSrmm1qZMrLSGGjQ7ARY2jYM08byOciiVCdYhYbIcA4AMhP%2bvgAgH/Box34o4mkD6S1M9cBmhmqsSGDeyyH8zUpnhjSFmrcwpeSbc954/9FF7626Cyc0V%2bGk5EKcuKAbuT1Wt%2b9RqSn%2blsFft0lhT/nZKu8AGoNxp/vK0EAEMg1044c4BNZA5C/mGkNN21kqD4o%2baarI2sNWenqtkRY/5Iem7u/OU/MFqU4wCw2RfVzCP6QisyFrtG0jQ44BEOcAOCETmICzsVW6QJ2JoSArS0TWDprM2Y0AkFgSIcJdxSfIyhUaZ%2bWc2i54CNcAjqy9o%2brRtZ6K3sc4Ku8HAl2IwSX8SYaMHObrQqOJVvACwHsIvKPsAW36aSWZXkWXOcSlEhuqCu9kKdwj5lBT6uANoZb4Q3V7cxowv6IDTEJDzgcMqfMAbPg3AOQJA3AafqIvjAGsjDePMfTBBpPYHI9wCH%2bKQ/jjQkPUQbiqJL7sru1D%2bYxtDo7TNx1WDzx92aqN16scqacZMnI5W%2bUVMBWuSprEMSbQhUezPblyFTKZK45BuWeJzbFlNJmDxZA5IzSJfQ9H5QVjoKHmAMBGlElWdOV8wIJkO5ixEzwpAFBwro5AQE/39bYxWK0PNvDZap%2bDJnXEGXJXmq8NZuS2ioQt1u5Jd4JqH0ARisk4xUVjbBffff/0W%2bky5wsMObmKq/aJWAp3FU1i348AqO4DJxq3O8Z4y6UDAI%2bITJEPmAoXja3yBBkycjdfE0QA1I8CfIMAjzWNIEe4KNEKFqE%2bZwKDahQFYt8DgMNSzTMwEUJ5%2b/OWWOsXLJVHQJM5PAw5WctSuFFraoghdw2zld7dUnOiIVC5R495wYxbfz/t1ufnvP3ANrZmNlPhWi3QhwUctS9Dl%2bY0YKQqD8CxNOCKQYBZMmviQ47aS%2bMSvgBT4dqF%2boPGYGPdSB6AWeG6IcQ7Fpe1HPj%2bAOCK73hcPDgdc/2J5W1wXXYHPKzz174jNsXWqsgM1xBssBmDjUnkyXlEYA9VaN1fIrAMSYzxVLxxjNoN8KYx1PjEJpri2W1szVsMGblSYipj83Uh5ANGBLrQaKYbXHhKbPJR9oKY4mMqR%2brvbJWHxVZ6wgw5uYul9BwwBhurh/MmMDPeNIIc8OLEvwAIDKpdlQiAr0vF9lcXL1s77ZkX5132rWaWCreVnPXFZyvOwkUEZIO/ad0HUwPVQw9ILIlHuRr/c4ZQw%2by20Rzr%2bwizQGqsYdQuNsYbS4TWXQy5q5FwVRn8lbs3eDP9H0sticVFPOMSqtD6qcJeUSQ1JyIspXsYzQAmWg74sBP8zVEAQNHkcY2r8guGzCkuFdsSqOHBkJOj%2bkB9ZjjPHmdke3KZ4KLyNmwCmsAg4aryW2Nt6zZSFS9MueXuqZiUfatjEmZY6OZvax%2bFp%2bxlXX9Tk1XzxKbEy0UC86wtTOK%2b2t25i96Mk5A/AcBKT6rfzFJ4mqgiWwtb5YvJrOWEiswwpJbEOprY9lER1/ie3le3HnEHLuEf4GuDBwJVe8LYXO44kjrjPfxZ563dWCqy6Qt5hkwh37iTLnPu0QfqY8P58Plg60guCiyo6Mg5wZwGYADWri8U/eWCCy%2b5HU%2b1f6sDDSicP5IPQQ8FawYXCnSRtRy1f53GU7skUD30JOGuuxMTkfNwYQMVH/6abAMRTxOsLhZY2osF5lpEnDhqn05iihfwNcEP6CLH3EDlnr%2bT5d1akSG6g6cJjNnjHYlBgPVI1SkUyjWHJj5xFEKp81sGfwOTJra7C7mG6iKBqYOl8rRYYi32sTz3v2/Pf%2bYBuSigcuYTIY7a//pGquL%2bqh25fOSsI5z8%2bKP9EuVc3JvL2R9idFwiIGTIXQqtt7a4cQCW4d4c8vI3bSxWXIuLH%2b8Fqgd0HMLfWsQ39RdwdG2FPEOCJnEYlfbUJkuo%2bQ2jt/5PgwBz053AkVrKW5hy15jclmyINY1K9kBu3Rdx7nErrjA9twdgnc5ba2YpPUma1FHJUrorpNaEx1e1izkC8Ga4ad9d%2bLOLUx05LjDCUrrR5EiVIdDAt0Ral2d7chnpo3ifN2HNvR33Nn6Daf%2bZh3dox%2bN/PlnRAVs4ap%2bniG9Kc9T%2bsCXSqkm2A6N9FNbsBFjYPgav9QC8U7kDCnX%2bujhL6dlbLDQPFXD1HQVsbbRUbFNYwi3LG3bD451DuZLZzEGADUpnJl0stIzQpI5dKIy6U73qVCdQe/JqjUZml%2bwAWO%2bv2q2XWZPVfG2wRaiPpBX2CrMhWF8arN37Saxl9MmHn3ruFkyHl1a0g0OgC%2b9HA1Qcta9XZk16CHc1z1ne8011P6wYzfuaBQis4fw1FuHG61Q8OzDucPtDoe%2bJ5iEoFOojZdu5BjQR3oP672JTWVLpyNjVriqu3FaxRUVmCglPlVFkijYh50aXO/eWSux1JSKLnaPylsYaR1Gcn1pAU1yM64YfWiKtZInIuqOQaxhAY7YCfahGZimLKZ0pi4rMiFWuDE/trjRJLYkaniaAeny71WQ2aYm08AhX5adUkeXlKbdOPUSHkRYsTXfluMAIGp2jy5xDiGrztSG3UB9Fc0YSlTPDVjkzdIk5zhXowyKVM8Os6YfPkaNFGv8fdUP8ixA0VrLWGm21c4lANV3mbGHIXc1MhbuWqfDEGDKXgSqyCugyp4ivCzkF%2bnAtXx/qFpmiDVJLmU9mLeeZQk2rB/L1vGtwqRrR0lcre4EltZRHWQpPPVNONrOUrkamnKyhSe2xEpHFWSwyWxlyMs5UuPvy4/ehEY27OmmLtdNYCtfil%2bcseJJCoSDndh12xPNrdoJSZi3vQlGCLiN3spSeKqbCE6LLSJImcZioYpumWGBWb2VpjJvpKluJ0EI4yjpRKH0ecZb/KOBiMnQzZnP/THUCyxJt1Ugt5Q62yuulim3kdq5Bv5WpkW3n6GV0udMo0Ic8CmfKZ4216mLNo0Utw7kw%2beLhKoY1C9HiRS37YLMn3S9Sk1kTXxv00iT20HauzreZoXJuZqpcRXxTliqyDkkt5cDXhUFhT1Ub/A1cusTx/rzFnz5DoVBQ5LgGJ2mvNg1CsdKRjrIU7jq6jMwy5K4ATeq0lwitpkKeUbuNrVVvZqhVXxdLDOsLRZYtTEKt89VtwABcdSQAp%2bHS9hRcxHipH%2bADW7x9A08TYBQLzYICtk64jaUVFHB0/BKRhc8hfByVK1scbRpZjQcapmNPftGhLAyTrMuw2j6J6HO4bmi1zJoooUnsom1sjXwzQ6XaytaYS0SWJFVs2ysyxoGnDaFxuAalIyNnKz0rvqHKXpm3aNk9E04bdzWOQo82DsBncluFiCEjjaViu54mcchKxXZBidDCK%2bSZONs5evY2lpa9kSoXfV0skW5jaznGYONKZOo4Ex1/ZBcH/eOMGY%2b%2bgZKiyWMAD9rK2uaw1Z5lpRLbGprUsZmpcG9nKT3bGHJyA03q%2bIJNeJc4KrqQY0EtqUuO0iIbhzOyc/C4/J3RhuHnxab4ezSJ/R/FAtM3pRJbMUq3%2bboQydUEm1lKNBMcGJSYyioVtpScRwRW8wn/HKO3eppQ7bmy%2b0Bunbur%2b%2bF1sTH%2bZanYvpUqsm1lyF0b2UrvV6zDhKnwfF0ism0u4pu2odf%2bqr2LsalfcrzewVlbONJrQ/W7H7TGm593JDre8FftXhxrHHk/1ji61JvdOV/rq3mVrfE%2bztX771lD4195rF9xHFEiv9Sd6rvLWd79lCXaOsdR3jU/WLv3/Xjz2MpI/TDVWd5j1vnqyzXumnKtt9ZGuKpKBdrQJzJL4uXq3lxYu7S2K0fartsPMN2T3jlb7294xxRqme9O9b8dqh2aF6kbfjvaMIrknUj9yHxvZtdiMtm7BL0%2bkO9h3PHfosAxukSTsLrdgp/wA1jNH8J2fUcfwA3WdNsVeNzt2/TizsE5x404nE3D66K4PWc/wOeVvVAYqhmiORPdWwl39UqeJjBf7ap8ZiQfxy8M%2bfvOxL7lGuxv0Br34vOh1/fiPd6H138Qv74VX//s4%2b13HC6Vn4Vr%2bxMxXb4AyyTMH87BDvT0bwnAafjz5%2bLvn4flIkzFZ/QCvBKoGniLcFe/zdEE5jIU7hdN0daHsX/55WGZ3QS8xqTjyPlYJuFrTfhX1%2biH%2bLnZ9xiCmPD2wk%2bvXLD0i6kLPlj94LLVWx/5qkQ6i6sPz0jtyKn/1UfpFZ6czf5EAKBgvoGSlOvv%2bsMfp2zh6m/J7s6F5%2btxzfEX/9sBOAPzk0k33H7XoULrRViFzz7RhufPDgDM1MYdxtzGH4vF/eyP7wrUyZw2%2by8Ttp0l21uAoAAAAABJRU5ErkJggg==' /%3e%3c/svg%3e) – Switch the panel to an SQL query editor. In that
editor, you can specify and run not only a
– Switch the panel to an SQL query editor. In that
editor, you can specify and run not only a SELECTstatement for getting data but also DDL/DML statements for modifying the database.' width='19' height='19' xlink:href='data:image/svg%2bxml%3bbase64%2ciVBORw0KGgoAAAANSUhEUgAAAEAAAABACAYAAACqaXHeAAAACXBIWXMAAAsTAAALEwEAmpwYAAAXmElEQVR42u2bB3iUVdaAP13rrm7EsmuBH3ZdsWBBRLEhuIKwPuuya%2b8FVBTEhlH2B0FAaYKiKwgpk8xk%2bkym18xMpvdekklCCklInZIJaaSe3/PlCxv58d8l4d/1eZbvee4Dk%2b%2beOe898937nXPPuQRx5jpznfQCgOPtP3IcZwxwxgD/YQYY3/FHOp9FEMQ5BEGcTxDEzwmCuPjqaTOyXnnro6ynX16dNe/%2bRVm3zb33X9bmzV%2bU9cyrb2ctX70u66qp07MIgriI4jqf4jzrlMb4TxjgZwRB/IIgiEsJgriaIIjfTLnsipk3z77rhhtvnnP91OnXzrxq6vR/WZs6/drrb7xlzg233D7vhimXXjGTIIgZBEFcRfH9nOI9rQa4mCCIqQRB3Hjfwofnrs7eMn/TF7mLtnxZsGTzHtqST3fnP/zp7rzF/7qW/zDqRf3IserDLfPvuu/3dxAEcQNBENdQvKc6xpNOjXMB4FIAuBEAHhwBeOJwD7wabBheZY9n3jNFEh%2baIom11rL0B9byjvdtZMtQreM9a1n6XUss/a6lLP2utazjPVt55j1b/Pj9961lJ8pk3sN%2bpEwMZdLv4vf8QIaUS3%2bAek3h9g%2bRI9Q4sqqhD14BgMeREwBuoLjPnej6gfPoF3yj5yoAuB0AngaAjXXdkOM/PMC1lqXF%2bkCzQutpUGu9jSqdr0mp9zcrDMEWRWmoTW4Mt8vMkYTYEksJLLE0b7SlhOZoUmIKt8tKg61ylNf7mxT4L342httkpkhCYo4miy2x1JiMwBxNikyRhNQYapPj96Me1Id6UT/KI0%2bgfpBb3wMHkZPivf07gfJKauqec6oGwHl01dpPd83uAXiiHWCHq6rbILNU1fG1wRRH7UuzVd40S%2bHOsBSeDFvp6cDPHJUvzdX4UzxtMCEoCbcK9dHGYkOsHptQH2nil4Ta8B5X7U9hf7bSOyqn9qd4mkAS72O/YkOsobgU5aKNAl24hY8ymkDyuF6lpwP1ov5ReV%2barw0mZdaqOtehHn0SYEcvwOOr122%2bjSAINMKFp2qAXxIEcd1/b/t2kaUs9a45mhQIdOEmnjYIYmMZcNR%2bKJI5h5hy1yC2IrlrCD9jY0gdwwypY4QhdQBT7gaW0gMshQeKZC6gS%2bwwet85PNr/h3J0iX0E%2b2F/lEN5/B78O94f64v6juuWOYeQB7mQDzktsRTfWp5%2b56Otex/CcVDjOaX352V7aeI53xYpn5KY41vFpvJSusTeJTRESTCJKd5kDLf5bOUZBzZLLOU2htq8Jd7GgMJeExEby6u4mkA7ggt0EeCOGqyPpw02iYzllSpnbdgQaPGZIglPabDVq3bXB6XminKBLtzAlLt6sL9QFyENxlb5kkJDtEZmrYppPQ3B0lCbD/VRuu3IgTzIhXzIKTHFDVJLxZZvGYqn9uQKcApfdqoGuDLeDg8w5e6VHLX/G7ba56KJLN10qQOklsr68gQIBgE%2bBYAPqPbXPoCNjcdga7BhZLe1rCNf46438rTBNrbSi1BDQn2kSu0%2bLDdFkzmxVtjVAfDpCMCGowAbK9OwzVHZvU8faBGJjeVxhsw5iHIclS8ht1XbDMFWhrum7%2bu6btjWOzrH11F630cO5EEu5CsQWbo5ap%2bTq/F/g/zl7TAfx3OqBpiaBHiYq/avZUgd%2bXSpPZBfbO4qkrt6bPGMFQd8FOCBiy/61ax59z0yyxzN3Oms7Lv/W7pm0RffCf8iMVa8ZSvP5OKvypA5h1hKT6fCXmNWexp25hWbX99bqPiT2Fy5INoC93A0kfs/28dfmiOwvFQaSW7Rehv1HLWvAx95UWmsSh9ooQsMsfe/pqueyRValriq%2b%2bcbQ6m5s%2bcsnPXzCy69CTmQB7mQDzmRF7mRH8eB4zlVA0xLATzCVnrX0YotjHyhKZLLL%2b1hKtxHIy2gAoBXCIKYRhDEeVSbQjlI1xIEcccnO3KXBeqHdqoctUFyjqp8HSW%2bIyqlq%2b7DxX9%2b7hGCIHBx%2bi%2bCIH5Nyd0wbeZtD5ZGkm%2bbYykJTxNIMaSOIamlMmotz3z9%2bbfsZwiCuJcgiOup9/wUSi%2b%2b5qYhD3IhH3IiL3Kzld6/4jhwPBMzgMqHBqDn8Y3RHK6%2bl630djb0gRgA/kIQxAUniCEMuqUz3lizcUF9D2zU%2bY54i2TOQa7an7bEUmJreceb1ECmUivzWdRAriAIYna4BV7y1vXz%2bCWhBBpA6agJhptg%2b8ef7fsDOmEEQVxO9R9/XYA8yIV8yIm8yI38EzXA1BTAUo7an10gshbk8Y3hHI6%2bl6P0ZZIAxQDwKACc/SOvz2ty2Pr7MgAbSoOtniKZa5CrCaScVV2ieApem3nb7DupX368u3oJQRCzOgCejzQDR6ALkwZQuw4Hajrhs1y%2bcTFBEL%2bjDHzWCaxnIw9yIR9yIi9yIz%2bOYyJTgDQAV%2bPPLhTbaPkCUyiHa%2bhBCzcdAynlaGSN6/8zAED381f4mHqr%2bxa3A2zR%2bZt8OAW4Gn/aFs/IKtPw9q5c/oJzsy68dgTgEgC4cMzN/u/t392VBlgRqB8S8kvCSTSAylEbrkjCLkOgddkDi5bdNv23s64BgF%2bivnG6s5AHuUafAEMP8iI38k/YAB0AS3iaQDZdYqcVimzBfIGpiyn3dPvrhkpx9QWAuTtz%2bNMrMjADAG4CgDmRIyP38lSepfay1KuB%2bsH9Clt1DA3AVnkzWm%2bjwVbRuUVkjr%2bg8tQvAoA7AeBWlJOYKx74/jX3RKhxZL0p0q7hagJpXAQlpniFPd6ZV%2bJreounCS%2bLNpMr%2bhx0zSNtMH3bftZ05EAe5EI%2b5ERe5EZ%2bHMeEDJABWMLXBrOLZE5akczlLxTZOhlSZ5/KUReMNsPfHJXdKwol9sc5av/j%2bkDL8zp/06uCktBKpszxQbE%2bvE1prxYJdOFaHAhT4e4uLi3ziU3xApbKu4Wt9r2rsNesMIYTL8lt1a%2byFJ5VHJVvvdx26KDUXOFiKT1HUY6nDdZLLZVynja8u0jm/ligi67S%2bZuX6wMtz3FUvscLxbbHkQN5kAv5kBN5kRv5M5M2gNyVz1J6vQyps4MucQxwNcFasTEuLZI59%2bxnaTYfYJdsphVbtheKrV/kC4x78wWlBxgSG4er9tvYSk8L5cH1sVW%2bKpbSoy0QWYvyheb9NJFlT6HYtotWbP4iT2D8BucsW%2bVVcNX%2bOL7OUI6l8LRxVD4nXeLg5wvNeflC8zeFYttu1HeArd28n6nZjBzIg1zIh5zIi9yTMkCKnAL4BLjyOSq/myl3pwvF9mG6xNFRJHNGC8VWPU1oUtKKTcoCkUVbILLoCkSW0gKRxUoX27xFMkd1kczZSbnFA0UyZxtD6igrFNvcBSKruUBk0ReILCWUnLFQbHMwpI5okcyFRusn5WTOowyZs7ZQbPcXiKy2ApHVWCCyYn8NqVtoUiIH8iAX8iEn8iI38qcmaoB2fAuoAtkMNIDa72QpvUmGzAkFIivkCUq7c3n69hyurpVsPH0bfs7lGxJ5AmOSJjR1oEdGl9gG0B2mS%2bzDhWLbsQKR5Wi%2b0JzGPrk8Q3sOyvAM7Xn80kS%2b0JQqKLZ0FoptfdifkhssEFm7acXmjnyBKYX9KLm2Md2oF3mQC/mQE3lJblUgu32ii2DLMCxlK/3ZDKkTnwAnS%2blJsBRu4Gr8wJDagSY0DecLjUP5QiP%2bO4yfacXm4YJiy3CByIoDHhvE8YZ/w3vYb1Te9Hc5kWW4UGQdpottJ5XB%2b3%2bXM461IfyMPMiFfMiJvMiN/DiOCRuApfRn0yVOGkvhcRXJXCmG1Akcta9fbjvUUhpqrbDEkjFLWTJmjraXl4Za4zrfkUqVs%2b6Q1FJ5WKCLtLOUnl58lClv8GixIdoss1TWqV2HDxkCzRXGcFu8NNgS13rqq%2bS2Q7Wi0rImrtrfic4TyrEU7j50iiSmeIPCXl1T4m2oLA21xFGftSwVQ/3IgTzIhXzIibwk92QM0AawlK3yZ9PFdhpdYvcViKwZpszVXxpsPdQLwPveAdkCANkA8BEAbACAzQCwbQjgy/oeoDkqjpaKjeVHMPRlKTy9Clt1ubu6V3a4B3IBYDclv4mS25EA2B9uApHGXR9lq7zkIijUR1pMkYQlnoCiToBvsB/Vfz2lG9sW5EEu5ENO5EVu5G%2bb6BRIUp4gOhQ0oTmYyyvtZiu8XdUdoAOAVdS7/3IAuAIAplPbULMBYAEAPNs0AHu1noYIFa9nzNFkSX0fbOgGeBIA7gOAWQDwO0oOfYI/9gB86KnpU/K1QdIPQKOVt8N3KYDlMBrUzKX6T6d0X05xrEIu5ENO5EVu5E9O2hOkXOGDlCucAeADwNIfEUUP7Yq33tt0ZzfAOmOoDafOIAY37uoeQXmCDKJuo1zf8Rd6hNelAZ6KtQJLqIu0M6TOIY273l/XDZ9u2H5wIRU8XfAjvEuRC/kOUq4wck/KEyQNoB41QC6vNHKQrevlqPwdfQBsAFj4D7bTbh4A%2bMAcSTpIA2iDSW/tMW6oaeRZgiBmniSgwWtqK8CyiiTQhfpIGxqgxNvobeiD9bNmz5tHBUI/xrsQuZAPOZGXNMBkYwEOZYC8cQboHp3/i/8P8SnL38yeMwDwkSmScI4aIJD01B7jV2XgRTTOSbatMZL8Le7j4XwX6kefAK2nwdd4DDat2/rtfCpsPudHeBcj15gB8igDTD4YIg1gK8gfjQZ78BFLAIgA4M/fL3jnneTxx4FN13mPPNAJsNEQbPGQ4TBGg5Vd4uqjsPKl1WvvpgZz/rgd6Mtuvev%2bW7sBXow0AXdcNBisOQrbpObKpdRewKWUscaznoc8yEVFgz355BSwTe4JSAMs4WIwJLbTaEJLKI9cBD1Hq1LkhsjLAHANBX/uHfNfuKQLADMzv732ulvmqBx1fzrUATs17vrRDRG1r8MYblN5ao%2bt3bGf84fZ98y/9eU1G6biAkoQF6Lc9et35CysSsNqZ1W3BKcMGkBuOxQN1A/tlZgqn37yhdX33PvAozMB4OqzL5iRRek%2bBzmQB7mQL49cBC0h5Eb%2b9EQ9QTIa1AazGVIHjS62B2lCcxdT5up2xI%2ba8PXjPjR4D7XjOnPNuj2zv8pXznvtnU0L1ny841Gm3POGJZY%2bIDVXlpHRoNLTqbTXGJXO2m1f0SSvvv/JnkfWb8%2b9d1%2bRYe7q7J3zXlr58aIvDgifNQRaN5V4j5Rw1P6xLbFKvb%2b5gCnzvPPJ9rwnPvp030PfMnR3v7l2%2b22U7uuQA3mQC/mQE3mRG/lPSzTIlLn8dLGts0jq6FU5av3%2bw4NfMeXeF5977cM/vvbOpkf35Eie3FekfX7nd4LlXxwQrikQ2bfILFW4lV6DvyRT7u4S6qNefkko7zuWduOenOJVe/NlL%2b1n6p7dfVD8/I59vNf3M7UfFxti%2b8WmuPN4NKgJHhYbyyWFIseOr/Pla7/Klb6%2bn6l7YfdB0RPL397w6LMr1v4ROZAHuZAPOZmnIxrsoAzAlLlobIXHy5A6MgyJvV%2boi9Ro3PUiua16J78k8olQH/tEaq7aKjFVbOdpQ7tZSu8%2bjjpQJNBFLByVr5mKBnu5an8lVxNQsxQeOu40FxvKdkotVZ8XG8q2c9SBr9gqX56gJCzja0PlTCoaZCu9rXxtyMFR%2bblspe8gXxv%2bUmKq2CE1V25BvfySyAbkQB7kQj7kRF7k5k/mCUhTU2A0GvS6mXJXii6xjTBlri6eNlgl1EcdxYaYiWpWoT5q55eEnFxNwPt9rB5lK731RXJXFxUNYhIjyVJ6qtkqX5inCXgEuohDaIjaBLqInacNujlqf5AMmRXuBEPqHBh1oV3dLIWnka30lXHVfj9fG3KhHtQ3phs5kAe5SD65K4W8ZDSoDU58DUiSjlAAp0A%2b7rNjkMGUuwD366lgp7dQbOuhWu%2b4htHcMbrEPjAuqsM2RJfY%2b%2bkS2zHscxKZvtH7ZL8xmWHqe47RR2XGyx3XjTzIhXxkMKT2OZEb%2bSfsCSao1yDOJdyUYCk8CabCTaafKEP0s1XeY2TD/yu9/Sylp5%2blcPcz5e4BTHuNS5ONjKbDMJ3lHmApPP1spaf/uJzC089UuAeoVNc4mdF0GFPuGmAp3AOsMZkxvZRu5CG5MBpUYDRIGoCG/InJGgBXU6bc7WZIHWmGxDFcrI9mzJFkrKwVDNWdoKrpBHVlCkpiraD3Hx402sozVr2/2SezVFZjZEc9ygOY%2bJTbDpXr/c0eZ2WXJdwEhng76KLNoHdX95qM4XaXylkXE%2bojrUy5i9wQwQhSbCqv03oaAuZo0uGtPWaKtYAB9dV0ggr1IwfyIBfyISfFOzkDjAVDuLlIxx0ZoQVX1z5zJBEGgP0AsJLaHX6G8gteB4DVfQDZtUdhB77PJaZ4HRkNKj3dSntNwFXVTa9Kw%2bcAsJaSX0HJvds0CJtCRyBP62nw4MDx1y82ROvNkYQy2gxfJUcjwHcA4A1K39NUw%2b/Zj1zIh5zIi9yTCoaSAEtIA4httALKEWLJ3V3lLaCloK%2blanMuTozAlQAwY9ljr9z45LMr79a4Gp4ob4fdamddaCwzZAi0aFxV3ev2MZTL3liz/k5RSQgjwWmbvjgwY87d9926O4f/cKwVsBhCxtMGycyQzFIV89Yc%2b5vcVPXCh%2bt2L1y3Ye8tAPCbmgz8mvI6L0IO5EEu5EPOAtIROh4NTnxPkAqHC2gCUziXY%2bhhKzydDd3/ODP09IurF9R1wcaSv2eGUpgZMkcSKwmCuOeEzNC5Y5mhQMPgS97aYz/IDIUaRra9l73jD1T5y49nhrpBjHzIibzITcUCSyYZDI2LBRTeTPswCDF2P1klFmWUq19d%2bdG97QDrDYEW91gsYK/oLPbV9a8gCGIulUA5%2b4R6hJvquuG5UOMIZobayVjAWReoSMLWjzd9vYjKO158sgo25EEu5BsfC5y2YChvXDBEpcaWAcA5Jymlw3KUacW6yP2dAJ8YyNSY83hq7FAGXl/85yfuoiq6zh0nN%2bVn5513SxfAC5Hm/xUMfc5VBx6mXN9LTjAcsmI8sGxcaqwn73QEQz8IhwXGcA5X38NW%2bjpbh8gp8BgAnDgFzqOmwG8kxviCJMAmfaDZSxkgba/oFMeT8ObTr709Pjl69lhydOYtc2enAF4ONY7wxgygctaFqtKwnVcSHp8cPf8EVpwCj7UOY3LUh8nRHuSdbDj8w%2bywwBjJ4RnI7HBt12hukBrsiaEwmRv87Ev64ppOwFy/j9oSS5siCZk1nnn7jvkPLaAe50soI4yV4N0VboYV7upeIb8kREaDCnt1ONAwvGvXQeGfqJ2ka6jpMj6xSuYGkYvMDfIMvXmCyWeHx%2boD/npifUC4GdQAsBzjfmrOX0j9MtOo3Z47t35J/4v/8OAupaM2NJob9HWUeBvVSlfdR8uefwPXj9vHFTei3Kyb5z34UGk4ucYcTUqP1weYK2KWso5vdhwQPEcQBG6K3ERtjV1O6UX9uD%2b4HLmYCnfX6aoP%2bMlXiNw%2b58H/1wqRK7G2BmtssNaGrfY5f6I1Qh%2bQNULtWCNUcZiOCRuRpZtN1ggFvmYpPCsrJlgjdBlWV2GVFVZbYdXVT65KLD6qGznEpngTxgMCXRgKJbYusSmul1oqN%2b9nqJ/cmyM%2b9SqxsTpBrLPDejusu/tJ1wmqfFBsiJFc/JLQEXM0ybOVZ9as2/y331OVJb88VQPgAnMlVlriTi1WXmIFptyKlaKh5E%2bnUtSTGdOL%2b4hSS2Wts6pblwDY3gfw2JoPPptwpShZK3xAqLySqhV%2bCgA%2baeiDg4H6YY61rOMnVyvsPzzIOdwDB5CT4p19ME8z4VrhE6vFMR21EB2OI/3wcugIvEVWi4fbfyrV4m819JER4mMU51i1%2bDn/7ED/US39RZQTcv2ceQ/Owfr80fMCtKX/3vMCtKWj5wW2zp97z0NzxtURXnS6D0ycTaW8plDOyww8qYEnNvDkBp7g%2bPecGLnrxBMjUyjOs0%2b3AcbODJ1HLSgXXXXN9KwVb6/Lenb5mqy75/%2b7zgx9PP7M0IUU36mfGTpzbO6MAc4Y4IwB/hOv/wHSyZH/X5K6iwAAAABJRU5ErkJggg==' /%3e%3c/svg%3e) – Switch the panel to the result set. Here you
can see the result of the query execution.
– Switch the panel to the result set. Here you
can see the result of the query execution.' width='19' height='19' xlink:href='data:image/svg%2bxml%3bbase64%2ciVBORw0KGgoAAAANSUhEUgAAAEAAAABACAYAAACqaXHeAAAACXBIWXMAAAsTAAALEwEAmpwYAAAUl0lEQVR42u1bCXSU5dX%2bAPcFClRRaj1VbLHF9reKgoUqi9DFhWq1VSqhRa1LpSq1/ani71Jka0H2JExm3zL7zDf7TGbN7EsmmUx2spHJHkL2He7f%2b%2bWLzR9DQgL2oP1zznsSDrPc%2b3zve%2b9z731eAgAIXP%2bJP5Tf/w/AxADMIAhiJgDM%2bjKuMinMQvtpP6YFwFUEQdxIEMTXvqRrDkEQN9B%2bTBkARG8uQRDfJAhiEUEQd9Fr0Zdkjdj6TRqMmeMCMM6WR8evTdTBAntew/eYCtePDrI1aw6xybXHBKY1aSLrZb%2bO801rDrO0a48wtas5cs9DnnjbdytOw83oF%2b3fjPG2A571uQBwFwAsA4CfA8DmLoC3avrg3cpO2FHVDe9Rq4v%2bfbmtrv/7d20//LUX4E0ASAGAnwHAgwCwiPZz5lgArgKA7wLAL3sAtpeegcOxmnOZgbJukyu/xW3PbfBm5dR7rdFarzVS68PfWZfRGm2XLafea89t9LoTp93Bkz3GvCSIT7bDoV6A/waApwHgbvR3LADXAcAjLQAfKu2Fep7Gny/QBmszjdE2kT7cJ9QFBwTaQD%2bfxOUf/q29jNYou9BOoS44iHaj/QJdMMkjfXlKR4G2BeAD9BP9HQvAjQCwIS8JTIbEXnKITXYeF5gGWQrXEFftPYsfKjZGuiTmWJvUHGuTDK/2y2h9Zhfaifai3SyFa/C4wDRwiE12MKT2orw6yACAJ9HfsQDgudiYWwNqhtR%2b%2bjCbHEoVmjt4Gl%2bVzJqXMIdOeYNl3cb8elAVNoEi0QDKeB2o47WXwaoDNdqDdqF9aCfaK8uKJ3ikvzJVaG4/zCEHGVJ7S24SVADwPPo7FoCbAGBLQQNkcdXe3jSRZYApd5aLDWET6SphRSr6d3YBbKUDykYA2AQAv72MFtrzG7SvC%2bCNSOXA3zTuUqbYGDEy5a6T6A/6VdAIWegn%2bjsWgAUA8GpBA3j5pB8YUvsAV%2b2J8dReJkvmfJev8T%2bfLrKtuPnWRXdjjp056/rFj6z75RJcP1771JIVq55c8qNHnljy0COPU%2btHq55YsnLNhiUPP/r0klXrn12y%2bif/Wqsu8UIbZs26fjHatWDhoruPi7JWcDT%2b5zLkzne5Gh%2bTq/bGGFI7xghINIAX/UR/xwJwCwC8nl8HAZE%2bBBlSB74hyFFmHz7EVP9hx67UdQRBfJsmFdcTBDGbJkpfo9ni9XSeHVnX0SxsDv26eQRBzP8C1xzaBrTnru27jq/7lKn%2bA1uVfRj9yJA5%2bkX6MKB/6Cf6Ox4Ar%2bXXgZ%2bvDQBT7uwR6oK4G/6RJrK8xFFmr1z/2PMLCYK4gn4L5tErx2NY4/xcQdPRq0eta8b8%2b2LXrJHvWr9h40KO2rMyTWR%2biU/69wt0QS9T5uwRaAMIgB/9PC8A8Trw8TT%2bcyy5q1NkCLvFhshegTawubyDIkdfv5jKCwBmfBFrLLNDO6u6YblA6/%2btyBDeJ9KHsplyVxf6lV8HPvoITAKAwtUpNkRcYkNkN4/0v5AcgPsBYM44jl1Hxw9kWN8DgHsAYAkALAaAb%2bJ7sDL7N5e5X6sbhKV80rdJZAjvERnCLnyg6Fd8GIDXpgQAnwxsaoRxAbgWAO4EgJ/QH/reP5/IRzBMNv4EAL8CgHvRoPOVpF8UALUDsFSg9aXQALinDgB1BCJ4BPYIdMGU0wBLaUdGF043A8DDALDdU9SmVNgTIZEhnJCYY7nGQJWtpg8OAsCzuDvooDjz3wTAvJo%2beFCg9W8WGcJ7RfppA0DFgD1CXSjlzOd3wI2fMlXIqX8dqzmXLtAFC45wdd0HWWo4yFQPMSS2Oks4qesFeBuLK4IgbqFBmDXFuDHlrhUAzK/pg2UCHRUDRgAYHQOmCICeAuC%2bUfTxmpXrfrbImlO7vrAJ/mwJJ0mOKruBIbEB5lqOKhvSxdY%2bpb0glFM9tD9eB8/%2bPU1137cW3XcrAFz97wDgVC8so4PgJQFgU%2bvwWcY8S3QAzCe9pcszTdEthkDlAbWryM0n/WcwzyrtBSCz5gFb4R6SWfMKjYEqvtpZ8rZQF32srI2qwm740gEg0oc2nQb4LwSANmaBIVS5iq3KfkNhT6Qq7Qm/SB/GQgQ07hIKBJ7GhwCUqp3FUqEusoOrDj5TPwQ/%2bFwRMoHTE/zfeKlwnCMQuOQ7gHp6R1TGuTJ7fKncFt9kjdbuJbNLnTzSf0aoC4HClg8IBFPuRAAKLOEkW%2bet2CrQRX%2bSm4Rvj%2byi6QAwqk95A8345j/x9Jab9h4Qz6eJ1chnzG4HuF%2bkD24W6UN7h3mA85LEgNmjjLg9K1b/SFUP/NGe26jkqDx16WIrcNUeYMqckCay9Kgchf78ethT0gob3t7x6ffprHH1RQAwk3b8doIgFs%2b7%2bRs/WL3%2bqR9uenHbD%2b64bfHCkVQLANdg%2bs00RlJE%2btA%2b4UUDMJwFxqbBa1/Z9gGSn6eLW%2bCoxJSTe1xgajvIVA8e5mh7mHJXlT23EUvPNwDgfoIgbqKf0qyLOALX5zTDnbvSZMv/ujtt/Xt70n%2bx8yDv2VSBeUNl%2b7%2byFE3O7hUbwymXZgfoginNAA%2bMqaER7a8DwEMA8GZhE3BtOfVWnfek1%2bCvdHmL21WdALuwyQIA3xrFA2ZMY9tTmQc/BwDWNAFsCZX3/tkSSX5kClZ/4i1qf48u0THGzAOAW62RU8vYCtfmTGNkd6Yx6kRiN20eINAGN9cPUQDMG2MUIn07APwYAJ4DgFdguGfwBl1zP0bT4rmjiqjpnHusLr9Bt7LeLmgElj23wajznvQg4PZYgzHZD5/SIDzw8h8/vO%2b1bR8%2beoCh%2bJ3Ukvs3eVY8i6PMbr8IAAKbT/VSHdWxAMyizxvyfTzfCwHgNroGwL9xh9wAAFdORIUnAQCdX7hy3U8fqOmHF%2bN1wNZ5yxIifaidq/ac5ZP%2bQaklt8mR2%2bRMNMAejass5bU//e2plFfeeXbPUeHvFbb8j9XOIgtX7W2bNgB8bWBzVRcFwPxLNZO7kNxOg3ub1lO23Bqt3egv6dhj8Fc4BVp/m9gQBpWjEORZ%2bcBRec7Ks%2bKlBn%2blTGbN33VcYH5nz1HR1qM83TalI7Fb5SzM4qg8uAPO5td91hCZGgCVXVQ5PBEAV9FrxiUC4Mq3Pzh8C328Xs%2bpGjqi95UbRbpQCUNi60wTmZFtQprYMpghc%2bDTrZKac8MqR5FR7SwWSsyxQxx19m6JOeeI1BJzsxXuTh7pP5toAM%2b0AKiaGID5dLfouwRB3Inpjs7VV0wTADwy8z86wEXu8VJxM3D03vKYUBuqYcqcDelia12qwJRMFZrK08XWRIbUnsdReYoF2uApsTFaK7PGC%2bRZcRNf6%2bfwtT4%2bX%2buPZMgcvXzSf7agEbLpWLVgSjGgqnv8I0B3k%2b8lPeU/PyF1/DI90/ZzpiJ7BZcM3JOTpGLB7M9NYSb%2bQZ5w8w1z5n7fnWjdUHoa9pmDp0J8jb%2bbKXUOsBXuOp7aF%2bWqvA6OMptkK90SnsYvzzRGvUJdqJ6r9g7xNL5OoT6U4JE%2bI1fjMbCV7uITkqwhBKCoCVwA8PupAaALplR1U0RoNI%2b/GgC%2bQY/RNpWdgffDFf37Eg2w8wzAnwHgRXq8dg8N3JUX0jqjmyvLzgK8UNgAH1vDSa1QG6w5Ic46x1a4OzTO4pC3sJ2bUzm0L1Z99t1o5cA7OdVD73uLO7gqR2EeS%2bHuZkjtvWylO8knfTG%2b1p/DUjgbWQoXUAA0gwMAXp4UAGwhIYdGLi3Uh14oPQP3jO4HxpJw56k%2bWN94Dv5Q0AipznhzljFQFTEFqyOu/BZnfh1IewB2Yj9g5172EropesUEzuMuwWyCNceWinZIs4RqHAIyUJEqNOOQpltiyikobqEGGy/TTZjl9LzvUeQirvwWCUvhKj4uMDadkGQ18TTeOr7W35Qhc5wVGyMUAMUtYKMfzgXsAP1nVPiF0lYKgCtHZgh5tbBWZIhuk9sSGUp7gV9iymnGL8DGI0flGZCYY0l7bqOpsAk%2bEOvCj9HxYd55miJX0F3du7oAnqgbgP3m4KkIX%2bNrSxOaB45y9Z0Mia3cGqkdYZb3Llu6Zs4oAQem29UlLfA%2bT%2b0l04TmeIbUVsdVe7p4Gi/Is%2bJUgUYDMDIXmAQAhbsj05TjEBsju9gK9%2bZI5cByesvj6x6q6IStIn2YyVK4HRyVp5yj8nTzND4QGyik4URm1kCmMVpojdYKwxX9fznVSw0l76Pff/WYbY8O3NMC8PipXviLK7%2bFFOqCVH8hXWzt5ao8pWR2qb6mj2KWPz1PLEJa/itbtHa3IiuuyjRGEgKtvwNb/GpnEbX4pH%2bo5PQFAsBRedoUtnyL2Bj96ABDsYUldz0xOLzVHkc2FjzZIxAbo1GW3FXBlDurWQp3dYbMUZcqNLcd4er6jvEMPRkyR73UmhdzxJu1FV1wiA4%2bD69%2b/JlF9BOnFCg0W9yYHIC9jrwmtUgfLkkTmXvThOb%2bTGOkNFDWJe4bnuwirV5MB8qx9s%2bm482GLoD3/CUdGok5p5ohtZ3D6hSrVNwBNACTHwGu2ntG4yo2SMyx/9l3PPP1AyeUr8ot8W2O3KZPnHlNUrWzqJBP%2bruQYfFJfxFX7bVnyBzmE5lWb6rQVJgmMlczJLYmBDLTHGs0h2sisSQwwlWDr27dvnsdfSRuxcoOn2o3wD5LJOnjawO1qUJTz1Gurocpc9S4Ey1qAPgjXXPcdm44EJ%2bvoMIRP3ad1vcB7NW4ikLpmdY2ltwJmaackSNgnwiAV5EpIWNCxzSuYqvaWbSbIbG/mya0fJIhsTPYimy1QBvI4ZP%2b0zyN72ymKdpMuktdSntBukAb2C82hNMk5hx5pinqFOpDJWyVp4utygaBPtSicZc6SU/Zpxy1d%2bvOw/wNb723d8WpPorfvx6pHFALtMGmNJHl3HG%2bsT9Daq9RORKuJoDdGOTo6dKFMk0UebxhDlWTDImt4ghHS8UmGgDMAi%2bNBwCmn1cSDZCNL2Qp3D0yS15I4yrmSC25J4S6kIKtyPZlSB2FGVJHNVvprhcZwtWmYLWnuBmONgO8VjcEz7cPDyffqhuEXcGTPVK5Lb%2bAIXN0nJDY2rkaX4nClrCaQqeEOdVDBxoBdnQD7Cg%2bDUyVsyieLrYO4BBTqAuW22L1JB4JepK7%2bHwd5fOUzejLr9yJlmM8jdedJrI0MeVOCoDCCXgAvullfAG%2bEAMQT%2bOrkJhjjkxj1C7QBgtYCvdppszZxZK7kHDEpOYYGSzr3k9PjB%2bgA9EdAPB9AFiLlaG7oJXPlDtzjwmMNQyJrV6oD9XIbfmVen9Fvj2v0efMb3Zp3CVxlsLVcoxv6OeoPDWeojaM9u/Qqe7uz42yJwcAg%2bqjrvym7ZmmKJ%2bjyk4wJLbBUVT4lfGo8AKKdraAHQHgqr2QIbW3cdXeEp7GV8ZReVrZCjdw1d5BsTF6UmrJVQtI/06DtxxH0j8c1S36bDgBACtOtsOfhPqgmCGxhVhyV5Kn8VEzOr7WDzzS188j/Z0spaszTWztYkhsDaS7JLsL4GMAWEU3Ua6c6lAFs0QbwHKpObJFbAz/Q6gPeeiGyITFEALwYslpsCEAmM7SM7OApXCdZiuzmzhqb6tAG2xV2BIVtli9OXSyd48pUPWbI0zVspuuvW7BeQzBAPdYvBa2Z0VrWRpXsUdsiCRZCjc%2baeCoPcCQ2nAU3yXQBcr13nJH2Rk4Rs/5F11E52iuLafq/mN87Ua%2b1rdTbIjYWQpXx2TlMAKwBdMEAoBpAyNnhtwJHLW3XWSIlKuchR5nvFlU00eNvnDic%2b9ft%2b%2b6Zby0NNLCokdnOD36XWkrHCDdpSaWwl10lKdvwyHKEa52iEf6KjHadwyP1J6jd9TciwBgnq%2b4dWm62PQbgTbwidgQcUwVgCG1q5hqcYsMEYzgrWpXsdcYrDpmCFS%2bUdJKnc3vTNbiHmmd0U0RHJz%2b2uCr3MWQOqRHefrIYY62Nl1sqdV5yxydw85j3LhjFEeYLgDzK7vgQT7ppbvCFzYao44AUkXcAdSAIysObGX2WbktUe4qaJX4y7rffGvH39fSCszrLzQojdoN9zvjp1OklrwPpZZcrjwrbjH4K6wVnXAcwSlqhtsnqRe%2b0NkgFQSxWkIAhPoQxoBBgS5UYQ4nzXVnqcD0M4IgRhqc0zEMucZSukpEXQ/ODbfRqe7e6X7ueNPh5AA1Hk%2bZyngcAfh9YSO4qTQotWNwSgp0IYsttxFp7AuYkibbmpMYdhWdHW6hO7zfoXUEt9Mt7RmXCoDaganrAygiVNAAHgQAnz5Dak8w5S6%2bwl6wHenl5940/L4LVXF8YUqSS6oQSdSDD/M0VnMZMmdOmtiaflxoflMXqFr14Nqnbh6ne3PNBHqfa0atqy5AHzCelmjKGqEnnt60kK/x/jid0gj59gu0U9AI5dejSiwMDIltgK3Mjp6Q2FL3M5Rv/s8/mOvpft8N9BfeOEUV1zx6rDV7lKrsulFqstkXqSYbrRL79vu7U9ehuo2jzD7C1/hCqHqbTCU2jk7QG0OdHaW3IwPPpYptK25acMewTnDmtZROcDIN32e6wPXPLnlk/TOUpg%2b1gyvX/GJYW7jqySUrV4/oCZ%2bZlp4QP3PGzOsonSDqGFHPiLpG1Dfy1F4W6h3/WdANoF8FE%2bgEKaVo4l9K0X6Wwl2aacrRk54yRqRq8OOu4W5MCs3ULkel6EZaKboVla2ocBUbwkam3HlBStFhrXDynAo1taitTRNZ2vjaQIXClh%2b3hGs8KD3/EmmFfahxRq0zpRVmT64Vxs7Mk3m1kMGQ2opRXY0qa5bCPTisFg%2biWrzz8laL546nFh%2b6ULU4DjofRj290lmg5ZH%2bPNTZj7ovMPhVvy9wFV17P90P8JfyDjiYVwsi3PZ48wJvYNi%2b4jdGZtIs7U66uYHd15Q%2bgDfx7s3Y%2bzhfuTtDYwYU1zT0wk2Bgq67uXLPQ4eZ2tWHmeRavI31lbs1NsGQcgZNKm4bcw/vq3Vv8AIVWXP%2bE2%2bOfnZ3%2bKTsP/fu8Ff%2b9vj/AvP7dTS4q7FVAAAAAElFTkSuQmCC' /%3e%3c/svg%3e) – Switch the panel to visualisation. This
panel allows building a pivot table, a graph or charts from the result set.
– Switch the panel to visualisation. This
panel allows building a pivot table, a graph or charts from the result set.
Note: The query editor can show you hints: SQL keywords, table and column names. In a common case, column names are shown in the hint if you specify the table name, e.g.
SELECT table_name.. But if there is only one table in your database column names will be always available in the hint. PressCtrl+Spaceto show a hint explicitly.
Run query
Press ![]() button in the right side toolbar of an SQL
editor panel or use
button in the right side toolbar of an SQL
editor panel or use Ctrl+r or Ctrl+Enter (Cmd+r or Cmd+Enter for MacOS)
keyboard shortcut to execute a query in the current open tab.
Note: Running is not available if a query for the current tab is not specified.
The query result will be displayed in the result panel (fig. 4).
Create visualisation
After running a query switch any panel to the visualisation. Switch to the disired type of visualisation with buttons in the right side toolbar of the visualisation panel.
' width='19' height='18' xlink:href='data:image/svg%2bxml%3bbase64%2ciVBORw0KGgoAAAANSUhEUgAAAEAAAAA9CAYAAAAd1W/BAAAACXBIWXMAAAsTAAALEwEAmpwYAAASa0lEQVRo3u1bCXQUVbouEFxQx91RRIdBcZ1xe49RB3XUQZnnPMd93ujgzLixgyyyqMgWlpAASUg6nXR30vu%2bVO97d7q7eu90kl6y7zsJSUiQsAn5nze5eDg%2blgTxKQ51Tp1w%2blTduvXd//%2b/7/9uQRA/sQMAvj1He925rr2ojn9LAC7Ei1zUYFwC4BIA55z8BIIgLsfnZRc9AKMoYOPQywLALwDgTgB4FACeAYCnAOA%2bALgBg3JxRsMoAEAvd8PcZZ9NB4DZALASADIBYDsAvAcADxEEcS0G6mcJwC8IgrhnN0vxQuU%2bWO6O71OSzvJyS6g52Pk17AaAlwmCuIsgiKtPlxLnBcBoefV8%2bXc095RK4TIU3gDwQKwTZttK2uabgo3ZYmPEVyArahdoAzXuWLesawiWHgaYBQD3A8DNBEFM/N7z/QkAcBWN65wMAP8BAO8ku2CzMdjIk5ijBi7ppdhKT1CgDXhJZ7nJW97H6zg2nA7/QNcTBHHdxQ7AZRPHXzd5Z57qSVei511f1UC6xlNl5euC5TytPyoyRtQifThPaiphyS1lZqm5pNTgqw%2b2DEIuAPwPQRBTCYK48rzmeyH592znOe6/uQdghthY8o7IWPyl3B6XCo2RGE8baFI44gFLpJUmNkY/URdVrNFRNVK%2bNlAr0AZbXLFuwwDA6rYj8AwG4bqzpcNpF%2bJHBGA8AFwDAHcBwMzO4/CRjqpNE%2brDfLktpjWFmsy%2b6gPahoNAOw4wL94Osxv64Y3qfbDZFGg0KGyxoNFfbyluOMLYD7AWRQJOn5vOxA4/KQAA4GoAmN4DMKuiCxaYQ815Al3QztP4faZgk6rlCKQDwCIAeBUAHgeAXwPAbwDgteoe%2bNxR0kE3%2bOqUem%2bt1VnSaW78Cui4Jtx3pnQ4HwDGYZoZPxrOHSMAd7YMwiyZuWSxQBfcw1Z6nEyps1ZoCMfL2qAQAP4OAA8SBHEjCmuAYYa4pu4gTJNYo89bIi0fOqIddLm1LMTX%2bFsNvrpg1xBsA4AXCIK4gyCISXje50WR6GHXAcA0AHgMn3cDwI1Yjp6XAAGAcQBwFQBMAYDnSpqOLeSQVCZT6pBxSMolt8aCnmSvAQC%2bRGlBEMQ1pxkGcf%2bvRabw81U98Lkl1KwX6cPVCls8Gq4dZH81EjV/AoDfAsAvvxFPV5xPZE9C6APAuwCw4ZsX2ojD6zGCIG46U6EZBQA3A8AjAPBKdQ%2bsIp3lLKbUYWYrPVZTsEnacnhY5CwHgP8CgKln0P0I/GuLW4/eg9Kh6SBssBe3CXSeaq0p0Kj1Vw2I2g5DBgDMBYAnBwB%2biSgWjzVutABcDwDPnwBIt0XbvAZfXSDZCbmDAG8TBIFy7PrTafFzhDwK4990HIV3DN669QJtUMCQ2L35YltcYY/b2o4Nh%2b8rGPhbAWDSOYrZtSjfewBe9Fb0zXWUdOzUuCotUlO0Quepjtb3Qx4A/DWbq70Pp9EVYwEAqbGX9g4BTWYtTXBIqk7nrdHGWodWR2oPv%2byLDzwMALejcB5loZyAq/2fTYHGdfkiK5vGN1oYEntYZCwOhmoPiQDgYwC490zd3hkO1A9MXfrFtmeiTccWW8MtCoEuWCc2ROoCVQckhwE%2bXL8j/1GCIG4/U00404Eq9AzUhHgSPRKlI24nnUmjI9rBS7RD2gmAhQDwIgDcc6ZoOGXVb8dV/PV4B3zBVfv42Vy9qUDuMhoDDdLGg7AHAD4BgD/gGjPWY7gmoP6gYQC2moNNOh1VYw7VDu5p%2bgre27iTNQP3DaizHDUAE04Wqu4h%2bDhUO4gGlintiYDKkQy7Yt3S2j5Y6072zr592vT7ziRF0QuhNnY/wHxnrCuNpw0oaHwTRRdavHpfvfAQwBoUFQCAIuo2Y2nrFefJxkhPPAAAb5V3whoq2bc%2bUHVgkSfe88ouhmLGh0vXTvssdc/1YwGAwCEz%2bYN5ax%2bv7oZ3og1Hc5X2RBmX9HZKTNFiva%2bOKbWUzsvk6P6ooGruPk06jMO9%2bz/U7srMPLGV3MPReWkCU0RgCDuq%2bmAnAPwFvfhYQvMsaYbS9mFzoHl2odz9Wr7I9jJT6niWr/U/lugcZrMbTgvA2ZQarp639Y8YEStKGo/JDd66oNKeoOS2mFJuj2e4k70rAOC/UY%2bOw/0WHD3DoiXSeHQTQ%2bqQZxZq7Aypw6b2VCmSXZCNc/7R76YPpkqUgrdh6kV09gQAPI0NkUcwPaNC%2bV3Bg9JxGkEQD0658%2b6H1qZk31%2bzf/ja27HqHBMAJynnKlzAUI5%2bPACQEqodLCSLKvQCXcihdCYVpa1DKUdHKPNPGAwkYhYnu2Cb2BQV72FrnXShxWIOtzAQkAgYrC1uOc18kBM0FT/vXXx92jeA5GFTZDUAvI3BuPM09Wcc1iqTcGpcg7XHhPNthtCKXNnaDTfhFfnDEYCVRbFuBVftqyhUuBMya0yl9VRvVTgSq7VUzUadrzaHdFXwBfqQhi60FNF4RrfMXCY5MOLsPIX1%2bsTT0RKiPwROTQ%2b8ry6qTCOLKkiyqCJJFlV0Gfz1De5Ej4FK9m1WWMv%2bZqBqTmr/79%2bVjrJ7Q2ij8H698zhkGgMNHrGpuFioD5vYKqqQLjTn0QRGPk1g0uUKzfZ8ic1eqHCbFLa4JNEOqeg%2bAJh8jgmiFXvKXtyxLE9oZdOFljBdaBmUWkqBrfQAaoXl1rKcbI5uHkNsm4WL383YP0SLNBmft2A1OwlH1WUXxA/AFImq9t%2bQQqzqAbrB3yAsVLjIrEKNKT1P6k6jS/wZBaSbQ1KkJ9mbdXxE3b2O68KkUQDwe2u4bTldYOHmCszFuQLzYbk1BmwVBXJbrETpSO7JKlAvzCrQvFXVPawaZ2E2%2bScALEXph0wVJObwM6dg4TT%2bQgAwASOL6sJ/IrVV0wvbRYawbg9bG06jS8rS6NIg4nq9ry4HAD7A192GmWL8KAB4gkr0LS6UuxkFchdVIHf18nVBEOhCg6ZAo8caaU2l8Qzz03OlH4j04QVUcv/q8r2wO94OmlDdoUi06etAXT8IWw7D2mD1V2/4yvfPwIVwwoV2eiZi6brAEW0XcFSUO09oQfLWKDKGOdW9wwXrWYT%2bGHIURdjvAlVfLeCSPjqH9BZxSO9eDukdkpij/Y7STpsn0ZNCF5jmbc3kLcpkqb9kSZ00oT5s5GkCLTyNHzik94TcFkuoXZUMpsSxIF9knYXb6Yk/hNV1I1aFq%2br7YWe8DXZXdsPm3hF1h6r99DEWqStRxIRrD40AoDoVgJJ%2bZ%2bleG5Xs3ZzLN83fksFZsjNPvonGMzILFG7UTveiWiEyRABJYok5ys3h6pdms7WzD41Q5%2bU/BAATMG3NxDSIzufQKmIhdOMYAUBR9Xhx/dH5IwBQrv8TAcneFDrfNB9FQAaTXM8Q2%2bl8TcDMIb3tAl0QuGofKpYVKkeSlS%2byLqLzTS%2be%2bAEj4CR3X40LzUnevQK/zPgxjofunRGqGTxNBET7HSWddjdOgW1ZgoXZbN3nHCWVJbWUasTG4nqu2ndcoAsdJl0VUb2vLpetdM8rkDn/iBdp4lhX4he4eP0Ke/APYyX2AP4NUc01o%2bngTjo6%2bB603TUdV%2biT46Eidf3JHsRe3LGES/pyeRq/k6v2dXLPBoCKypJZytRiY3EdV%2b37WqAPHVa7KqMGXz2NrfTMK5QVvXA%2bAFyPC9yLWNkhEbP1mxxFfL4G/4YK3P1Tp0y9cZQrOw3v8b2FqQqZLTsAYN0p4z1NJfrelJlLV/HU/lyRPmzja4PtXLXv/x0AJCZm%2bSsPLDMGGmnmYLPNFGyqskZa632V/e6y1iGaJ9Ezl3QmZ1W0wz3n8gYwdf6usgs%2bNAWadpiDTaQp2FRqDjU3eiv2FzccAGZNLywS6oJ/z%2bHoP2ZKHOsQAFJzqVmoD7f%2bGAD8ahDgDaEuvD1PZNXmi21NhQo3SMxRVGE7lY6Elkt6v8hma9/wxLofwqlwrm7teT1VtyZfZBMgJyhfbDuCqjZfGxg0BRttOqp2czpduihlN2dpDtewEQEgt8ZMImOk5ccAYGo/wFs80p9G4xmNuQITCkNQ2OOIZ3ul5hJTgbxofSaLfNPsq3%2bAlpN1xTnGQ/XkOa27%2bjMazyih8U2VNL5pSOlIIIV3TEfVFJFFFVtTc0RLNu0s/CSboz8FgOIfBYC7jgG8LjGVbGFKnSRLVlTHkjmHhPowiI3FbWRRhZqvDXyWyze%2bavbX33u2/fpTBM7T1nDrSqbUyWVKnaVMmfMg4myRIdJvLW4zmQKNG3fnKxZszeQtoXGNG74FwPDjRACSun9R2hObOCpKxiW9FRzSe5in8Z9Q2OP1Bn%2bDTGqKrmKIrK9Gagcf%2bq7a%2b67uxoLpWXtxxwqOylvAJb1BFEkoquS2WJcrvk/riHasyyrUzE3NFi7O5ZuGAZBZy356ACgdyVpLuEUss5R%2bmsszvhWoPPA0NkSmYwPj96eIobsxld57EOBlrbt6NZf0sfjagJ%2br9vVchAAETqhdldVFZV18hS2%2bIpNFvicxFL/dcWx4b%2b5fMLJPh4zOAkxxHyGHuaobXtS6a%2bYItaF1PE2AKTJEKL420H1RAqD1VFd6y/dzVI7k8vRcyUeZLPVigTb0pY6qzTYHmy1qd1WDypnstUXbY4kOYPkq%2bpfQ%2baZ/ZTLJhQyxY5NAG2TILKVuoT7UdVECoKNqKv1VA2zSWb4sNUc0LzVbuCqbrdvFkjqlbBWVZEjsw2zB1wb7TYFGvdxa9iXS7VsyuMtz%2beYUgS7EkFtjLqE%2bvPciBuDAtwBszxau2sPW7WYiAJSecobUgQEIDBgDDXqZtWz9zwoALVVT6ascYKucyWU7csRz03KlK/KE1lS%2bJsATG4sjHNJ7UKgPgcxa1lFU1qXQeWrWpuVKUKR8kie0pAi0IYbMWnaxA9A/AgBNPDedLlvOEDu2ifQRtsxSFuDrgv3ImFA5ky1UeZ/U6G9YvStfPncHTbw0T2jdPFwDLgFwCYBLAPzkAfga4DWpqXQLS1akKpC7alnyohPIclI5y%2btc8X18maV05bYs/vzUbNFKusC8g6f280SGSDFHRQ0KDWGQWUo7nWV7lVpP9do0mnj%2btiz%2bMhrXuBVJYZEh4uOqfX24t9hvj7YbzaHmDbsZygVbMrhLs9m6zYUKT77IELHxNP69AuwKW8LNLkdJx7Zsjm5hym7O4gwm%2bSVLVpQjMkQMfG2wGQHKVXuPK%2bzxuMZdlc%2bSOhYwRkzRsXeDA6gbVPt30PgmY67A3IZXC024wxxqlvG1gbWb0llLUnax12YVaDJGaJAqZ0odgLq8ERpsHKZBZGBuSi9YlcFUpeeL7QK2iooypI4jCnsCOCR1VO%2btc2pclVtSc4RLNuxgrtyZp9ieJ7Ry2CrKy5Q5D6Dnon0BjbsqaPDV79yVr1i6PjV/%2bQ6aBBmkTLbSY2fJi/ZJzCWAQBXqQ7VSSymHxjMsyWHrZh8%2blyl6Oj/gIMCbAm0wlS6w6PNE1ha2ygOof5eaS1qtkTaJUB9as3lXIeL3NXvYul0FcpeES/oSTKkD2dJoEvstoWatwh5fh3TA5l2Fn2ay1GlMqZPHVfsiLHnRoMxaBjyN/5Ax0GDXUTUpaTTx4o3prBW7Gapt%2bWJ7IVftcxcoXPul5hIEwAkdVes3BRvTMpiqJRvSmJ%2bk02Wb6AJLPpf0WQuVnr0iYwQBDyJjpFpuixXSBebFNK7hpWMjpuiYALgDfantKuv%2bVOOqytd6atwaT3Wj3lfX5qsa8NT0QaY7vu/jPKFlDkNsnyu3xj4zB5sz7NEOvcHfUKWjajtc8X3FVT2QF647tJAldc7JE1o%2blJpKVht9DemOkk6VKdgY11I1HY7SzkT5XuDG2mAZl/TOyeWZ3hfpIyv0VN12R0mn0BxqLtZSNe3WSFtVrB2kFd2wWmyIvEfjGv7JVweWalzVKfZoB9sSbgnoqNpWY6CxkSrvswRrDm7XuCrnkI7E09iHHFMK3IA7u5fx7s4XAMMfMe3BHt4c5PD0Acw8MLIF9cop3iHazUVb4JsB4H1krR0EmNk3suP7Z7xthfYNtuHr0He/8xDgxwFm7hsa9gbRltdfYeRrlBT83DTsJaIxZnYdh2eGAF7CHuNc7DFm4Xmuxvcju/5e3I5fNhYALscgTMFt7iO4vX0C//tkm3sr/nsn/u0hvBX2JN4Cn44d35PXTcG7NA/iLzufxH/vw1F3K/687Q583f14nCfwuA/gMU5eNxk71Pfi/1jxBJ7nb3HhuxW7UcimH3fB9wUutuP7bo9fAuASAD9XAP5dj/8FgTy3EU496IgAAAAASUVORK5CYII=' /%3e%3c/svg%3e) – Switch to a chart type visualisation.
– Switch to a chart type visualisation.' width='19' height='18' xlink:href='data:image/svg%2bxml%3bbase64%2ciVBORw0KGgoAAAANSUhEUgAAAEAAAAA9CAYAAAAd1W/BAAAACXBIWXMAAAsTAAALEwEAmpwYAAAQgElEQVRo3u1aB3Rc1Zl%2btikB0xxYQnFCSzbAYvCGjlPIEtiFA7YpG8AhAcPCAQIbAoYsa4MhptrBtowkS5oZaXrvVdN7k0Z1RqMuWbK6LatYki2rfMt9ukq0toLBke2IeM75juZJevfd993/fvdvDFfh2cpReLZKzcUcjTvlVBSWtgoNkQmFvQwyWwmEhihExijItcpZQb6PadypKku4USq3lbyZJ3U8uGHTjisZhlkE4HQANyTb8ZxQH9nB14UKRcZYvcgYPSC3lUBRWAqxKQahIXJCIbUUs3OXWRNQOsq73KUdFndp5/uZfNPzzCkCThFwioBTBJwi4BQBpwj4xyUgT%2bbaRiA2xrlqZ6VbZk20CfRh9gby0mJTHBJznL3WuJMQ6MMTaldltSlYJ5Nait/KERc%2buP6PGVfNJKCiFc8LtKHMAk3AIdRHmgT68KjSXkYeDomlCCJj7ISCkK9xpyAvLCXocSbarM5E26YdBcYXmM/55mwCnsonEpviEb42uI%2bslClYB4O/BmpnJdSuSvbaEm5kWRSb4i0qZ4WuQBPYkMHTr35zw%2barZxBwY6x26KU8mYuTI3EEOQp3F1kFQ6AWxmAdOxGVo%2bLEwVkBnS8NS6QRel81WcBhU7DOawrWffqnHOXLTEa%2bMSeDZ8jhyN1SoSES46n9g%2bQmcoMpVA%2btpwpabxV7bYvtYq1CaIi0KQpLDTyV951tHO3D69Z/cs0MAm4Kpwd%2bmyOx87JFtnCu1LmHmL051ABzuJGdDLGkE4cUjIFadu5kAQq0gYN6X7Xf4Kvesjlb/grD1wQ3Eyjt5TuNgTqrxp1qkFoTI8Tsxeb4hNRSPCqxFI2KzXFIrcVEF4aMwboyR9FugcZV%2bXq%2byvvAex9nXzGDgH%2bp3YO1Mktim8QUN8ttJWmZraRfbIpPstvJUnRIaik%2beCIhNsUnpiw3NqHzplsCqV59INX7bo6k8FmmZQjPEvQDvx0D3h8CuD2ArnMclq4JmLsBfTdgaB%2bDtW0Utr2AZgz4HMDr%2b4GHm/pxi9mTvJhhmIUACAnfA3DvHuD5rgls3Avk7AWUnRMwd07AQsbqAfRzATo39vteQNcHaAcA9SCg7gc0vYB2D6DrmoCp7RBsneMwjwB8AO8AeDLdhfsYAP9KcSuAuwGsBPA4gDUUT1D8iuKXAO4HcCeAawFcBmAxwzALABCcD%2bBqAD8C8DMADwL4z1nGm2uQeT0K4GGKR%2blzybs8SedOnr8awE%2bJWAO4hhBwBsWZAL4F4GwA53wJFtP/OZOaPFn1BQzDkLEIiCWcdth4i48y5lxgel5nzcBsz15M50Xe%2bTTm1Oeb9TmLYRiiR99hGGbxCX862QIn69Paj8XJdly3nWv4%2baatwnve25x/E8MwFxFtOtqkz56xV84FcAGAb38JllChm95L0zpwUpcewKUA7nEk2l7QetOvJDtZESTifgl5r/GpeR65YABuo1gB4N%2bpmq4F8F8Uz1I8T/EMVVmi8MvosXfByRYUAN8H8HSkdjDDHGnkhmsHN3UDTwH4MYB/pnM8koCK3Xi5ohUvNQ3ije5JbGk9AHntPrjSPQhW70Ggpheemr3wVnUhlOpEuL4Pzu5JFAwC61uG8Xhp86G7AFxBVPckvv8ieuxucJa2u2S2RKnCUW4zhRu2Oks7XuwH7qVzXHgEATyl7zMCmTWRp/OmHUpH%2bS6RMTZGAggSRYmM0QmhITLJRnNTwdGozptOWqNNYkVh6TqO3LUy0TByPTliTiIBZFveNwRk63zpBo7KM5grdzZxVF6ryBTbWtmJ5wAsJ0fzEQSQOIAgj8QC%2bkicp/bRWKDpz7GAzptmr2fGAvLCUiNP6X13G0f7mLu4jWyFc4%2bHqM7ELIJLrI7s8ZsBvFDZCZ3MVrKXq/YiU2Qd2Sm1V4vNcWNlB97HlBV8%2b4iHZAosWZl8S1a%2byi%2bSmIvCfF2oV15YAmOgjo2eCBkEJKAgAQ2JByTmol1qZ6WWrw2u35FveMRf1nXDySCAeqErqrqxtqjx4DZrtDksNscHRaYY8jV%2b5Mqd%2b2XW4qqy1nEBpvSAhO2n/7%2bB8uTubXkyNwlcuGpX0iWzlewW6MOTJHaX0wQGCWLINQmLhYbIuNqVTJtC9TKZtfitXIl9Vbx2/3HZAkchgOz7ZT3Ab1TO5DaRMWYVm%2bK1ImN0mCwSWTSppYjkMgZC1X0eAG91TeB2hmH%2biWEYshWm9GAOMkIri%2buGTrgGUFW/p3ovNgr0EUuO1FHFVXr3kOQLWTgjm3%2boZRfQFmuqahhA5j7gSVOw4ZZH1rxMLOdb85GABRTEz/8BOZITzYeEfF24LltcOJQnd43zdaFJEvqS7Us0TOkog9Je1l0Yb3HHGw5sHwJeoIHckvlIwCLq4l5Ozvcx4H/9yV4PXxcalpiL2FOLZJ/IqpMty6bBbCUQ6EIjfF14l8xW6k/sGs%2bkvs7l85GAMxiGIUr%2bw3jd0AOtB/CBp7w7KDbHh6fyfSXsXKdJoAnYsXy1fzhH6tiTp/BUORLtcoA9Fq%2bcjwQQ8br0puW3L1c7KlaV755cH0j1KvW%2b6kqptbhbZIyOEJEmIi40hA%2bJjNFBsSneydeFduXJ3VVclS/gKG7LA/BrNhdAhHA%2bEUCE67Od6u%2bu/3DnbRyFe5U53PiSq6Rjk724Nd8UqnOpnBWNYlPsgEAXmhToQ0MiY7RFYi4qExlj/gJt0CA0RLiORNsGmvS5ht1O84wAIn5XmIINt%2bdInfdv2i545IPtgjUiY%2bRlT3nXNmu0KSy1Fg/wtYFJvi64T2iIVAgNEavQEBEK9OEtAn14ndpVsSbVzcYHVzGnM0vmGwEky3TpMLDMFmu584lnXrnz3PPOv%2bPtD3b8ovUAXovXD5sU9tLefI1/skAb6BbowyGBPiySWIo%2b1XqrXjWH6x7V%2b1I/8SU7r%2bsCLl3z%2bhsXzDcCSKrtPBr6EhG7jDg2t9654ioAj3WOQ6xxp7p5Kt8ET%2b1vFxgidqEhusMYrPt9037W7JePAd%2b1xSsvJJ5rZP/YWfONgAXUAzzjz47M1Od0mujMNfhrOzhK7wRX5WsVGCJ6kSn2gT/V%2bxsAt9BYYDoiXMhGhyeKgL/m0h7N/f0a95Hkxw5TsKGdo/BMcJTeXQJ9RMXXhzcE0n2PUsdp4RE3foMIuOkL7y7DFGpoz5sioJmvjygLdKH1/qp9JIFzzaxjfIMIICHx58Zg/UwLUPP14XeC1f2PAfjhrFmr40nAV538sUSHs/yNFHYyDyNAIzBENoZqBojre/3hCZG/SwKO8pJHI2CmBbTw/0LA4/8IBNwyTQCrAQpPC18X1goMkfdCtYN/1wQsoEfTgr%2bRnFuOtABKwPG2gKKv7gcsorUE4sx8hzgz9Hi6gtYbFv0N%2bkBS%2b1nGQN20H9AsNEZVAkNkgy/VS0TwuuNHwFRK7KvkBM%2b64bplS9tGcCNNUv6K1h7IBG%2bcdYJfnYDbvyB1pyFQ28VVeScLNIEmsTkuy9cE/mCNNa%2bmtYEzTjYBl7z78c47BLrQY5Zw0/%2bYQg25hUW7pR3j2AzgIVJxOsb3X0g9Qa7eV72Hp/ZPCg3ReoW9jM9TeX%2bnsJXcT/2A40CAzDlrXYCWyad7Bs6g/vsdwVTvUxJz0QaeyifMFheGcmWuCmdJhw5TqarvzeL7H46FFCS7S871M8vbQTJEj3YDCrU72VegDZL5pyzhxiyBLvRcjrjwZ8NTFazT54wAc7hBKrcl3uQq3Cub%2bthGibMPE7bFtC5H9t5PaLPCG4nmQxl6X7UqXxOIZgqtTVkiW6vWk/aMA2%2bTo4xhmAsZhjmPVHh7gaU9wNKOCSztBpZ2jmFpuKLz8tZe9oWvpsJ2G43vN4ZrBsNiU3yMrw9NmsMNxYnmQx/JrYnVTzz14vLLllx88Zw6QtME5Ku8D/VNeVkzS2MkULmMns1r9gMb0z3gBKv6zNZoU1zlrKjh60IduTLXvjy5q1PlrAwlO/FpywhW3/HTn9/MMMxNz7361m0ZBboV2/O1d23lqu/aztPctTVPueKdj7Lu/Hg7f4Uz3nJvbQ8er%2b/Fq5Vt%2bMSf3KtXOsrbpNYEhMboeKBqn68PWCfSR3/MMAzpYTpvVpE99i3QwG4BntLz0O4hVmCmCSAsX/LWpm0/ahjAk5HawS1qV9Iu0IfTfF2oR0jSVsboODFTnto3WqAN7lE6yhOuknauNdr82uadsiff3Zz7y8/5xqd4au8zPJX3aZ7K8zT5yVG4nskSmJ/OFlrWSozRV7Xu5AcqR3mBxBx3CnShNEfpGSHzVTjK91X3QkOKpa%2b88eG1DMNcQPOJC%2baEAK2nqsoaaZIobCVvZgutK7MLTNfyBKZz6BG3lAhS%2byGsjdUPfaL1VFm4Km9Dlsg2zFF62D5DlbOSLbrwtUHwdcH9MmuiweCvcVojTTxTqP4zY7BuizlUv80cbsiwEEQaWZhD9RnGQC3ZQp9rXJU8iSlu4Co90WyxrTZbXNieK3f1Co3RLkdJe/Eo8BnpZSI5xL/68sdKgM5blbLFdomVhWXrtmQrVi278ebryd6lQnf3MPAHd1mnWOkoJ6W2Fo7CPcJT%2b0hJjW2XVdKxybgCPZu87Jdai1vlhaVphb2sTGkvK1XYy8oV9rIKCvq9tEJRWFopsyWSYlOsmqv0tGQKLXszCgx9WSJrO0/jT2q9VfaytslsmvklTRJf7p8cGwHplL2oVaS0l6/b9Fn%2baoZhlhGm6Vn7VHHTqFBojKZzZc6%2bPIV7jK8Lsjl7UrIi/YakdjedviYZXAK%2bLjRRoA2OF2gDs2DG7zWBiXxNYJKn9k3kyl0T2WLbWLaksD9f40/L7aU6Q7D2o0C6by3td7h0RgLk%2bBDwx78QcBn16tZU70G%2b2lVZLtCHOwX6cL/YFCMZ2lEyLulDnm5iJt9J77HYFDsks5UMq5wVAxp3qk/rSfWRnxp3chr9M0D%2bZ0DrqerVuJPdaneyVR%2boqXSVdZii9fs/0Qdrfr3mhf8mwnfVbH1CR7jTx7oFCskWsJet25wlW3Xj8ltvILk5euyRstOLB4CtyQ7InSXtLrU7WSI2xZoLtMGBAk2A1QFiEcQyCrTBg2pXZXu4ZiDefgi6UUA4DvAPAKL9gHQmhgDpCCA9CEjGAVLx5RL39wvt%2bQTA76kvcBvDMFdS4TvtuBAwUwQz%2baZVW3OU17vjTedTh%2bd82q5CUs9PNA/hbZ2vmiM0RJzEPeUqvWMsAeZicBRu8FS%2bfbbYrvgokEELFv9G22/uA/DALCBe3X9QV/puauo3U5%2bAxBQX0X0/q/DNCQEzj0GOzLUy1c46O4eLDUlUXhlrOnifyFz0O4mlOEvlqPDIrSWtQn1khKPwjO%2bU2Id5at8ub0WPAcBLRENo/W%2b6CnTuYTiHmvVZ9O%2bLvk4EOacpsZmeYNswS8BsfXlnv/7hjmttxbvvr2jHiw392JLqgCpSPeg3%2bGvLhIZolUAfiQfTffm0pfWiE9ljMCcEkB6huh7W/GYjYOHia65aQt3WW6kJky6zN%2bv2YZsxWCeVWIrUwXT/n6g7u2TeEDAzGvyyJikaDJ1G%2bwovmiajaxJrzOHG9wSGaKanomcjJefCeUlA0dcrjJA44XJdoOYXcnvZa1y1b7Mj0fY2Fb0lc/GiX%2bfzf5O6vHAC8dk3AAAAAElFTkSuQmCC' /%3e%3c/svg%3e) – Switch to a pivot type visualisation.
– Switch to a pivot type visualisation.' width='18' height='18' xlink:href='data:image/svg%2bxml%3bbase64%2ciVBORw0KGgoAAAANSUhEUgAAAEAAAABACAYAAACqaXHeAAAACXBIWXMAAAsTAAALEwEAmpwYAAAS9UlEQVR42u1bCXhcZbk%2bLfuOgIiACxRB4SqKgCgVUKtwC5cLKm7oFRVkrYLK4gJSEK8gWtpmmyQzmX2fzJl9OZPZ9yWTmSSTPU2aZt%2bavWnavJf/zJ8%2bsXqhpYCtcp7nPJk5Mzk53/t/y/u93x%2bGee/4Nz8A8Ofbfb%2b3%2b77vAfAeAO8B8K4caxiGOY5hmBMBnA7gXAAXAfgIgEsAXArgowAuBvB%2bAGeKChMnMQxzPMMwa/8VciIx5DSGYYhxlwO4GcB3ADwE4OcAHgfwKID/AXArgP9gGOYChmHOIKBRAI/Zgzz8qQzDnM8wzCd6pvC1ReDxrt2oTLTP2vy5kYC3YSgUbtntbhyGfBJ4dg64%2b%2bY77rmaYZgLGYY5nXrPMVsO1z7w8JPnfOven368XObYEGmefMifG6nUc7mkSO8fqVC49pQpnIuV2rpJhT1VcKX7NPGu%2bafUXO6O%2bzb97uqLrvj0BQBOPGZzB4DjaXx/rWkYmzyZ/u0GT95bYwjuKpM5lkX6AGpqg6hQulCl9U6onJmkI9ErTu1YfAbAXQCuAHDCsQwASXyfAfBItG1apONyQakp0i3S%2b6erdT7IzDHILHGIaoOo1vkWxMZQv8qRTnPpft0yQED4AgHxWAbgJAC3LAMvm4Kt8Wqdb7hSU7cgMgSXxMbwstySgMKagNQUhdgY2lel9S5Waup2qxyZlh2zEAH4OqkKxzIAJwO4bRwQKOzJ7hKpbVmo90PCRkCMV9nT/FkEIcZfr9b6INT5p6Ot014Av6IedCb1JlJGzwZwBoDT6P1PpIlyzVGS9/7mzSkAbh9cRo3EFBkQqD38asutCShtKagcGSh5AJI8CCpHERCSG1hfobt3HhoAT9OyeTuAr9Iyei2AK0l%2b%2beZdPzifltmjEgCyQhuHAaHMEusrV7ogNob52FfYklDaU7zxMnOc9wi1IwOtuwFKW5IANcf6C%2b3%2b/EhdesceZX4A2/ODeCE/iCfyQ/hhtm/5Ti7Zt37TLzZfRXnDSUcrABvmgG1aT66pQumaLVe6lkWGwDLvCZYEnwTJa3LySZG8ZiP7pWx4TmIMj0rYcLfUFKmXWWKc1BxTSkzRbRJT9DmpKfqIzBT9toyNbHBGOj89W2SSZ1DidXSQJxq3NwD4tSc7YJZbE80iQ2BYZAjMiwwB3nji%2brQa7NW4shOsv6XXFulstkU66y2htrjR1xzUcQ1uuTVurNLWybdLbYJtYstfy5WuFxTWxNPe7OBj88B9AO6hYfIVAF%2bkf/caAJ%2bk5fQSSsHPo4n1FArWynECgPdRin4lzT3XA/g8Pa%2bn166i9yL3OfnNADiB/vF7Gofxgi3WrVI60imh3j9aoXJDao7xcc/nBHtqxhbtao61zViaB1HZNYlXd87jpZ0LeKF5GJvd6b6XxGz4z1trzFu3CI0lpTJbhcgQqNJzOaE/PyIpjEA2tAzZLCDcD5S8/nB/AvA7Srd/RCsKAeezGnfzOspOV%2beOM6jh/0VpOinDf3g92f6Zni%2bRhQTwMIC7KRjnvmG/AuA4AB8YBK4JtU59PViYfMYa7VLLLLFChco9V63z8sZLzVGoXfVjJN5bx/By8wB%2bnGidvrNnmn/gLy0BX033LN6jdmYeFajcvy9XOF8TqDlxtc7L1tQGvDJzLKu0p7o1zvoBrbthl97T2Gb0NSfMoTaXLdKpskW7t1sj3b%2b3x3sfcaX6vy6zJNd/5oZbrqJ0m4TN6b98roys/MamIfzOEu6UGeqaPay/NWMNdxaskc4WU6C1vtbbVGcOtSmyO/dtpoBe/oYJGMAayucvvubGDdekepe%2b0TKO5/2No8ZaX1NOZokNC/X%2bvSJDYEnjzu4KtUzWtozhicd%2btfkrDMOQB/wIwzAf%2btR1n19njXZc70r23sX6Cw%2bz/sKzrL%2bw1ehrkus9ebuOy6U0rmy30p4ekVsSo1JTdKfYGCLhFhfqfa5KTZ26QsmVVWl9L6oc9T/jMgP3Znct396/H%2bsBfBrA1cQ75oGf22M90iqNN1kqc/SVyZ1zAhWHSrUH5QrnQqnMPlCp9qTZQIuyd54v0RsAEG96H0nC1N6/a4ZInSYxdxF1mzsB/Oz1hPWXxiGYTKG2gtQcHVU50h2BpjFV8wgevODCiz9HjT%2bHrtDZGi7zYRrTpBR%2bE8BPADyxCDw/A2wZA0Q7F6BtGoIxVJhkLaH2WqU9qavWedUlEpv0NSEr3C6xlkvYyFZbrPuVZPfCHwb28yHySwC/eP3hNzcNQWLwNkUr1XV9JVL7XIXSDQlbTNBVmjqUSG17BCquX%2b3MRIJN49X9S3iC2kNAPJ94/D9yhLUUhNVawMcJQyQG5AegVznSBZklnucy/bKWUTzwje//9HqGYT7MMMxZDMOcTBPUaVQvIEB8jCaja2iCIve6jfYP3wPwQMsonrBFOn8rYSMvlckcW7aJzAICRJXWa5CaY3aNO1tnCXd4ffnhulj7TF2oMBG1x7qb1Y5Mf40hOFOt9S0RPlKsUJSk6XwQGQKzckuiR8flQtZIpyzTs/Q8XZAr/o62r66JB1NRSpNvngNe0XH5oIQNx62RTnF%2bAA%2bKakM3MgxzKXWtEw4OK9Jlrvp5HG26TqQM8YNzwJXWcMdNCmvibikbuV9cG3q6xhB8RVwbEknYsEXMhqM1xlCL2Bjqk5giY1JzdEZqji5KTdElqSm6n5wSNrosYSP8SUAgfIXwFvJebAwTgPqqNN6UjsurZ4oedN2BzvVQuTddxaeM3mZTjSHI6dy5am/D8GN6b/NXt0gsV5nTu97/FpqhNRS4dS%2bXqK9zJ3beGm%2bd%2bW6qc/6xVPee59I9i1uS3QuSQNOYzRLpyCpsiVFSknkS5spC7azn2ShhqjxPISWaVCt7midp5HtCvX%2b5TO6YL5Ha%2buWWRGikWCFuIot6uAAQt3mE9beIq7U%2bQ40hKFA5Mk9rudy3071L62lNfit6APmd94k0/ovp3/gsfcBbaZn7FlWhSkNN4wkpG5lX2VJFAAg9t6V4piq3xA8AQN6rKXUn4UCSY6nUvqCypwuTwHaam04%2bXAA%2bQWo06ytsEai4mhKprbxc4XpRZo49mhvgkwupy6e%2bBQDW0rxxCm2gzqL551z6/nRKZr47BcgNXL5fUhuC0rra6OLP1Sx15TPynoBAqoPWneudA6oA/OebEqOD1SKazO5hfYXnyhXOra9VG0u2iS1/kRgjz%2bYHeI3wWkpv/9829wiZKmGM283%2b1u4afQAK6vIrBktXASClnnDgvSnKd646Lr9zHqh%2bqwAQteg2o695U7nC%2beJrQnbrdrGlTGKM/LVxgC%2bV5AHPegcBuPF1Slti9BZ2kh5EQ%2bO/2J0WvWHFcAXPVtN8KPDG63wokzmW1M5M%2bxRQTsPrsAAgWfzCRWC93pP/QaXa8yQpV2Uyh1hijIhyu/Asjatz3iEASKN26zhQrePyA8RgHZeHxpU90JYXO9ViOBxIgs4ML%2bOVyhxLJRLbmNyaSI4CrxDGeiAJHgYA5xXGcbXMmrhDao49JDFGXq3SeDVSY8SY7d3/KiUZ5x0OAIcIzslP/r50HYB72ych13K5vpraEBQk81sT/MoXK0D8gPuTxEg8hHhCTW2QEKKRcoWrWWVPm8eLPcINh5WwCQC%2b3vkzH3hy86VbakxfcKf7v2uNdL0sNcWsUjYWyOxYInH1bcKw3kzqOgSD11Cqeg5NfqRm37UX%2bHWia0Gr8zQ21dSGxoR6/2xNbWhObAzPi2tDSzW1QcIDDsS8uDZE9Iw9MnN8UGFNZjWurNnbMLQFwA/JPOOwBFz6wCRmzt1w57eumAU2Ng7gjzou75Oa4s2prsVa2sV94G0AgLjmByhlJaztN93TKIu2Tqtt0W6Lxt1QJzXH4jW1oUah3t9dpfUOVao9MwIVtyyhHlCt86NM7txbpfEOq%2bzpeleyT5PvxwsLRePXU4Z73FspVyfSqdGNs8CL5mBHQsrGBqJts3W0Vl94hACQhzrvzFPP%2bmTXbtzdPYM/%2bhqGXXpPY5PGma3XuhtsSluK5J0akSGgr9Z6/QIVl69QcX0VSvc8SXZCfQAlMvs%2bEvMCJddk8DSyzUN4nrbFBNQLKVVfcyQJidzoOUe8Ny02RiYCjeMx2qR85AhV6QuqVb6rFebk7cGmicc9mQG51tXQKDaGB1X2dM4cbFPqXLnnxYbQM3Jz/I9KW6paaUuZVI5MWO2sb1U5MoNKR2ZIZknskLCRtNKatPiyI39ZAr4P4FOUdR65CkXnhk956gdjYmNkzJMZjFJVeN1buNeppCegcXnrGPBAuDC12RHvrbCEOoymYJvfFu32x9pmFD2z%2bG3XOL6Tapu7s30M3%2blbwKO7FvHboWW8MgxUDgGKQUDZtwjRjhm81rfAV6f7aAn94EGq0hEBQLq8TcGmCa%2bEjeyyx3qCAJ4kneNh3uo4eq%2bbRoHvN/TheVeyT67j8h6tO%2be1R3fUJrv2lPbv5Q35Me3piWx2GWWm11L%2bQa7fQYWPbwD4b9px3kT1A0KzD0%2bNfpPyReLowVjbjF3CRjtZf0tgeBnPkXaXJMpDHZXTucHnQs27f6Ry1L8kM8d1IkMwK9QHetTObEOkdUYyvIyHW0Zxi0gXuqJ3N9/Hn0Y7yuNp2JxKr51BZxJn0ten089OpnLf2ze%2bpwA8EO%2bYM0vYSIfGlU3m%2b1FGx%2bY30VW6lH6PGLkiah6/amhCPrt2Hvie1p3bXCZ3igQqj1PCRtM6rrEh0DjunCzqfBsZhvkolbPeOVn8MH%2bRuNT98Y45VsJGuqSmaIcr2VfXMwvB60i/QBPi/bSMfZHmhrOo0PJhGpNkgPKELzf61yqtT7FNbGHFxojR2zAiHwa2UaGTuPRV9HfXHC0ArKGN0UORthmTmI30Vmt9EwprcsAa7ijUZfoTvoYhzp8f0cTaprb3LuDxZeArdBUJcOuXgcdS3XvLTMF2vVAf5LZLbf5ypdthjXYL9hY3YWykkhwB6%2byDhZZ3HQD6xdU8gEhbT/mbxh0SU3SgQsUt8RKUPrAsrg3uEen9Y9XauvYaQyBgCbdXdU3hoV17cXPjIG6YAu4NNE5skZpirgolFy%2bR2ZMVKk9A7crq2ib4PEIalQveKI%2b860NU2gucSeOaMKn7OqexzR7viUpM0XFiPGlGSBNCGpJyhRNlMvuUQOXu0riyvvrefWVLxTL5KJkb6LhGabnC7a5QcZzCljJ6cyOV/ft4skLC4so3W/F/BgBrqTtu2LWITdHWma2OeK9Tx%2bU7JKboHOHeRIMrSlNxiPR%2bVGo8i0Kdb1JpS%2b1wxHuSiY55R6Z3v45LD2hl5ri%2bXOFSyS2J0lw/foMiUfkyLW3nHEmFeicBIETlfkd8Z6XUFPOKjeF2qSk6ITVF963IUrwIwUYgMYaXJWx4v4SN7JWaYnvklsS80p7ZrXPne3VcPqGwJnVCnf9VvSf/KG2j19HKsPYQ1al3HQBCWK5bBH6tcTU4SmWOzjK5c1KoDyySNnRFm1tRYeT8HDHJX1M76mnv3gCRPrhX687lHfEesTXS9bgpUNjob%2bj/GM0tR/XmCQLA%2br3AnzSuhnSJ1D5VIrPzGyiIscXReaIoS1E9jt9TQIQJVwOMvgIMdU0QGUJLhDZP0PourvVeTocpb5ilj5YNVGSgsdXgbW4rU7j2iwxBFPvvvxUgV4uSK0Bo3Tl%2bg4XCmppqm4CJToouO5SVP5oA%2bBKvyQVau0nWlx5k8GoB8uBr/OYqQ5CEQv8c%2bP1EGw9LkzsK9g78jQeUK1z7iSy1Ot7lqzZP8Nd4rT7Bewnp0cvkzn1aV0PHUnEcfsuh6gZHxX5jmgNuXAL%2bV%2btuSJXK7LtLZXayW4yPc16c5DlAMRRITigKlhn%2bO6Uy%2b/J2iW23wpaqny7O7794sCBxLABw3V7gGa07ay%2bTOzrLFc7dQr1/iY9xVwOvzq4AsKLK8puoDIF95QrXVKnM3qWwJt2j4NneFw4WJY92AA7wAFeyRyAzR%2bvExlCr1BQdI7V%2bZRPl6pgnYEjYCBlgjhPOIGEjPku4Q7hc3LXxmSPZVvvPAoBngoP78Fi4MLnFEmq3KO2pJqHePy5QcftIklspg0SLF6i4/UKdf1JpS7aYg232YNP4tp45fgvMbVTtPf5YAmANndmto73AD7I7972s9%2bQdAhXXvl1iJbwANUZeiiYJDyUS27RAyXVqXQ3uVNceosvdR7WCy6hGsPZYAoChgsYpVLK%2bdgr4iSu5s7TGEKwTqLjWKq13VGgIzokMwbkqrW9MoPa0i/QBvz3aLRgDHiTDiPMuOv%2bDdEv%2bsbP6/2ic3TTMCyJfHgE2RdtmtvgbxxThlil7vHPBl%2bha8EVapx2BxnFVtGV668Ai399/jSrGJzH/Ascauk3tMlrO7qbTlofpfqKf0df3UUWHbJe9fLY4OF3zrwDACjE6jc7wiaT9oVX/V3QJnSR/iH62Muc/4Vgz8h2vw0f1f5e9B8B7APybA/DvcvwfvZsb1HrYxEIAAAAASUVORK5CYII=' /%3e%3c/svg%3e) – Switch to a graph type visualisation.
– Switch to a graph type visualisation.
A pivot table can be represented as a regular or multi-header table or visualised with a chart. Read more details of working with pivot in Pivot tables.
There are some requirements for the result set to build a graph. Read more in Graph.
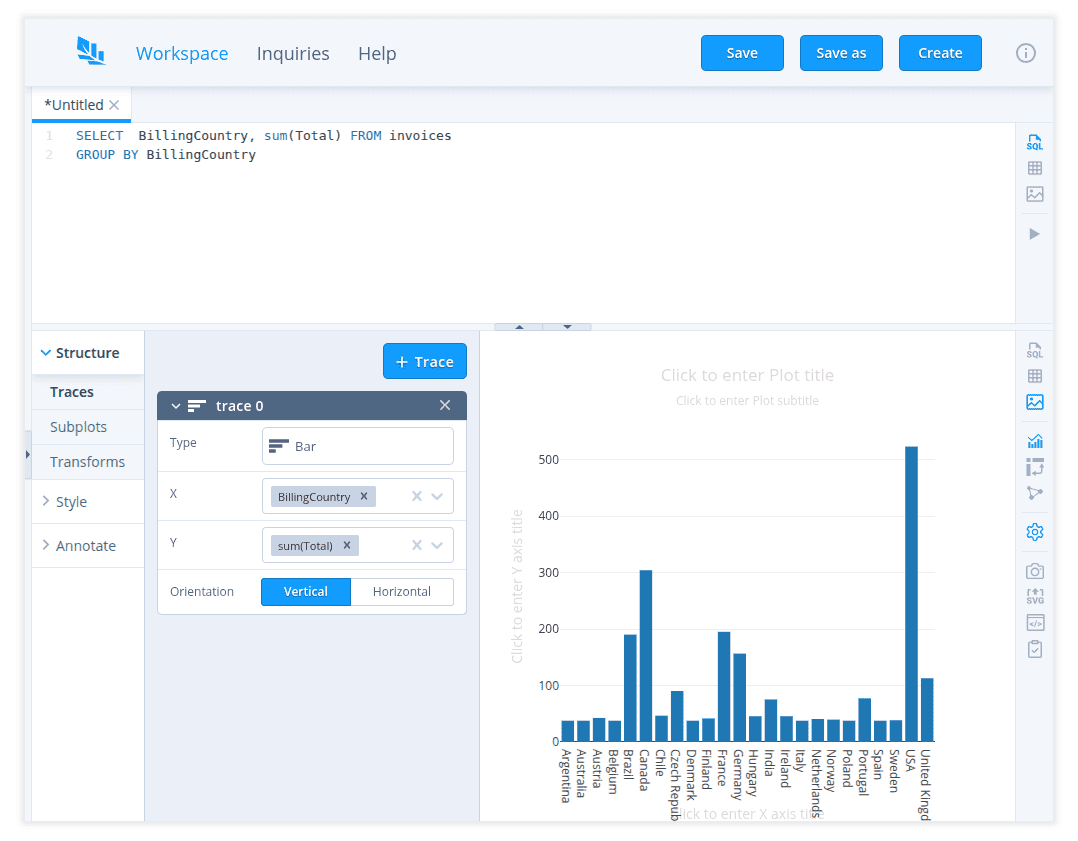
All customised charts in sqliteviz are created with a react-chart-editor
component (fig. 5). The same component with some additional features is used in
Plotly Chart Studio. Explore its documentation to learn how to build charts
with react-chart-editor.
You can save any visualisation as an image by clicking ![]() .
.
Save inquiry
Press Save button in the top toolbar or use Ctrl+s (Cmd+s for MacOS)
keyboard shortcut to save an inquiry in the current opened tab to local storage
of your browser.
After that, the inquiry will be in the list on Inquiries page.
Note: Only the text of the SQL query and the visualisation settings will be saved. The result of the query execution won't be saved.