How to get a result set suitable for graph visualisation
There are some requirements for result sets if you want to make a graph. Here is an example of building a query that returns a result set appropriate for graph visualisation.
Let's say, you have 2 tables:
-
house:name points Gryffindor 100 Hufflepuff 90 Ravenclaw 95 Slytherin 80 -
student:id name house 1 Harry Potter Gryffindor 2 Ron Weasley Gryffindor 3 Draco Malfoy' Slytherin 4 Luna Lovegood Ravenclaw 5 Cedric Diggory Hufflepuff
Each student belongs to a certain house. Let's say you want to build a graph with houses and students as nodes, where each house is linked with its students.
We are going to use json_object function to form JSON documents. The result set should contain
both nodes and edges and we have to provide a field indicating if the document represents a node
(0) or and edge (1). Let's provide it as object_type:
SELECT json_object('object_type', 0)
FROM house
UNION ALL
SELECT json_object('object_type', 0)
FROM student
UNION ALL
SELECT json_object('object_type', 1)
FROM student
Note that we included student table twice. That is because the table contains not only students
but also their relationship to houses. So the records from the first union of student are used
as nodes and from the second one - as edges.
Then we need to provide an ID for each node. Let's put it in node_id field. The node_id value
for students is taken from id column and for houses - from name:
SELECT json_object('object_type', 0, 'node_id', name)
FROM house
UNION ALL
SELECT json_object('object_type', 0, 'node_id', id)
FROM student
UNION ALL
SELECT json_object('object_type', 1)
FROM student
Each edge document must provide a node id where the edge begins and where it ends. Let's put it in
source and target:
SELECT json_object('object_type', 0, 'node_id', name)
FROM house
UNION ALL
SELECT json_object('object_type', 0, 'node_id', id)
FROM student
UNION ALL
SELECT json_object('object_type', 1, 'source', house, 'target', id)
FROM student
Basically, that is enough to build a graph. But it is not very meaningful without labels.
Also, it would be nice to distinguish house nodes from student nodes by color.
Let's put additional fields label and type that can be used in graph styling.
SELECT json_object('object_type', 0, 'node_id', name, 'label', name, 'type', 'house') AS graph_object
FROM house
UNION ALL
SELECT json_object('object_type', 0, 'node_id', id, 'label', name, 'type', 'student')
FROM student
UNION ALL
SELECT json_object('object_type', 1, 'source', house, 'target', id)
FROM student
Run the query, the result set will look like this:
| graph_object |
|---|
| {"object_type":0,"node_id":"Gryffindor","label":"Gryffindor","type":"house"} |
| {"object_type":0,"node_id":"Hufflepuff","label":"Hufflepuff","type":"house"} |
| {"object_type":0,"node_id":"Ravenclaw","label":"Ravenclaw","type":"house"} |
| {"object_type":0,"node_id":"Slytherin","label":"Slytherin","type":"house"} |
| {"object_type":0,"node_id":1,"label":"Harry Potter","type":"student"} |
| {"object_type":0,"node_id":2,"label":"Ron Weasley","type":"student"} |
| {"object_type":0,"node_id":3,"label":"Draco Malfoy","type":"student"} |
| {"object_type":0,"node_id":4,"label":"Luna Lovegood","type":"student"} |
| {"object_type":0,"node_id":5,"label":"Cedric Diggory","type":"student"} |
| {"object_type":1,"node_source":"Gryffindor","target":1} |
| {"object_type":1,"node_source":"Gryffindor","target":2} |
| {"object_type":1,"node_source":"Slytherin","target":3} |
| {"object_type":1,"node_source":"Ravenclaw","target":4} |
| {"object_type":1,"node_source":"Hufflepuff","target":5} |
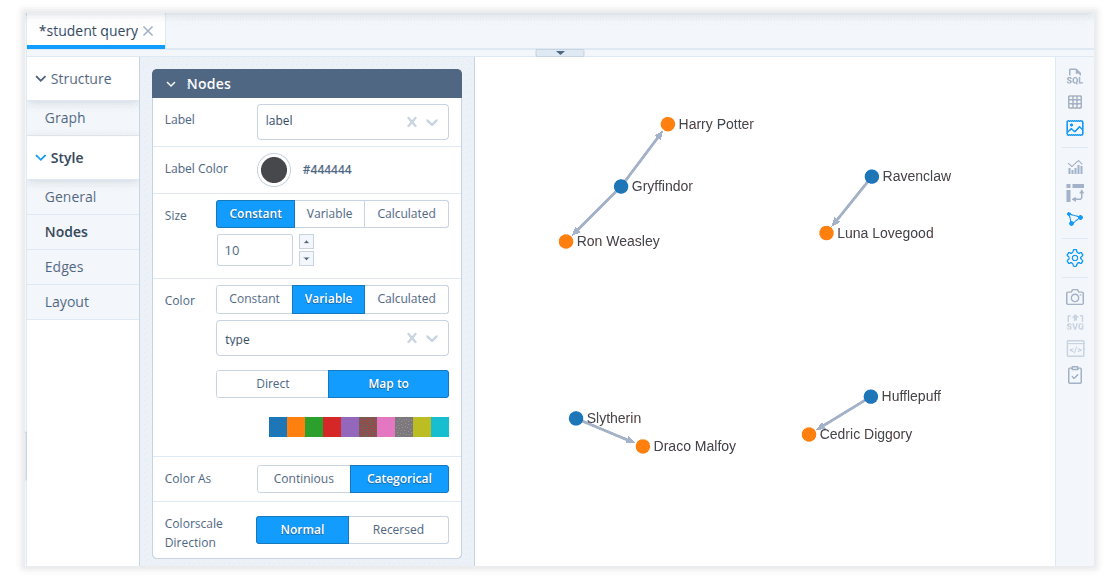
Now in the graph editor, we can set mapping of the result set documents into node and edge properties, set graph styles and get the following visualisation: