Pivot table
Pivot table UI
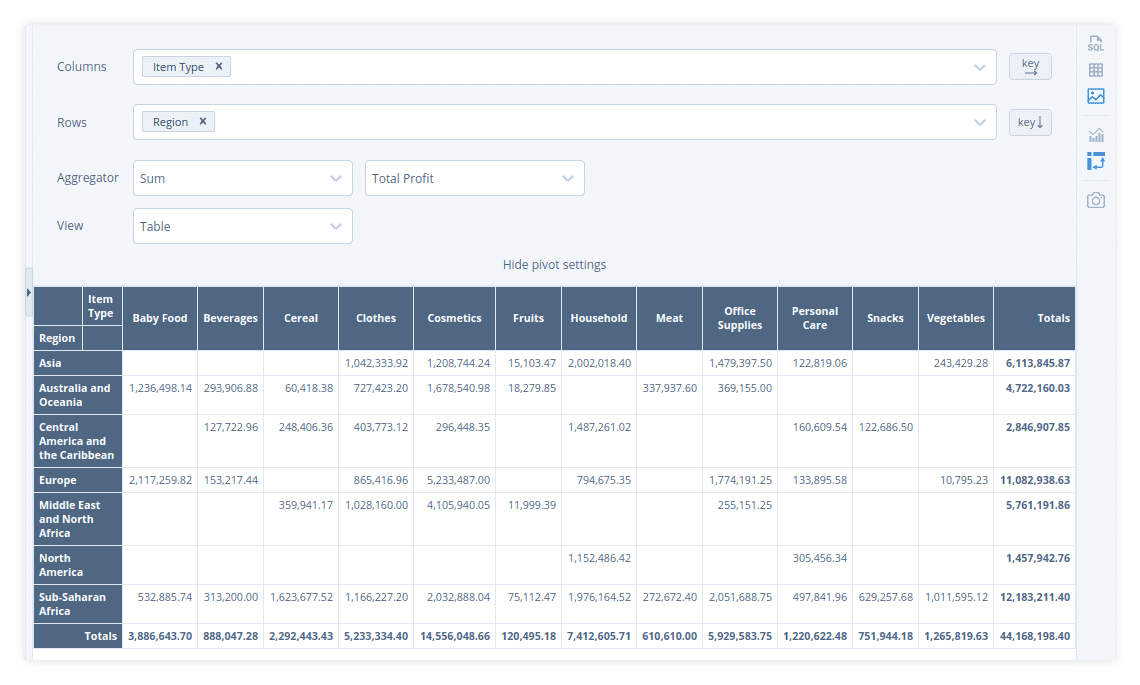
Sqliteviz allows building pivot tables and visualizing them. To build a pivot
run a query to get data. Then open visualisation panel by clicking
in any of the two side toolbars and choose a pivot mode by clicking
.
A pivot visualisation has the following settings:
- Columns – choose one or more column names from the result set. The values in the chosen columns will be column names of the pivot table.
- Rows – choose one or more column names from the result set. The values in the chosen columns will be row names of the pivot table.
- Order of columns and rows.
- Aggregator and its arguments – a function which will be used for pivot cell calculation. An aggregator can have from zero to two arguments. An aggregator argument is one of the columns of the result set.
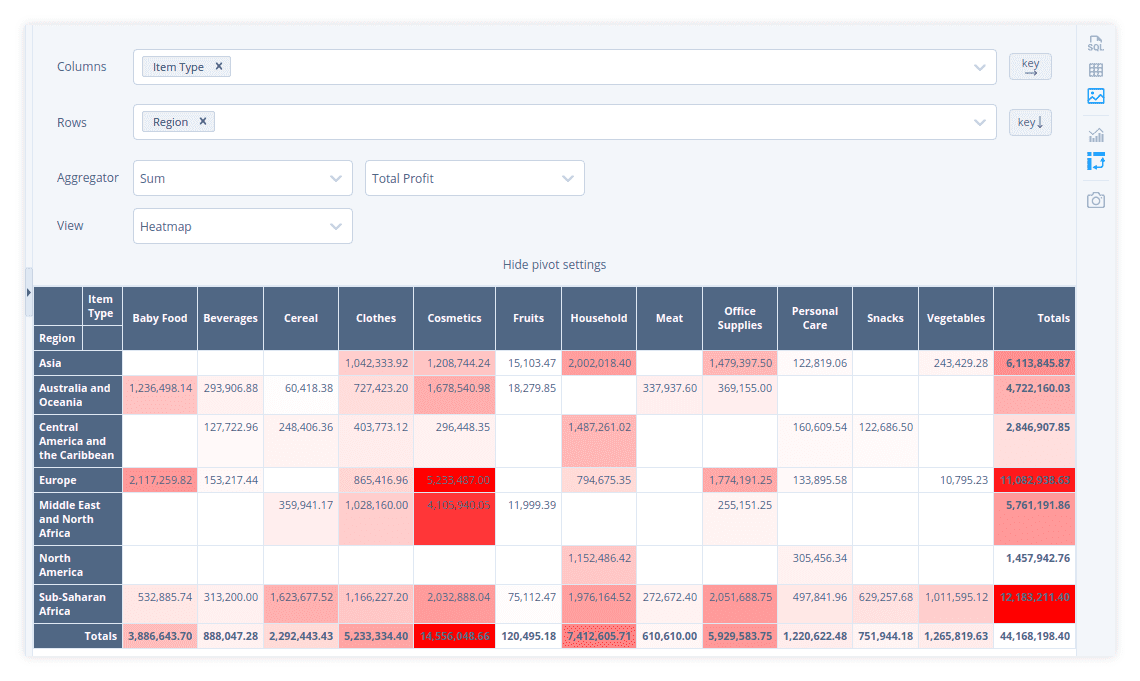
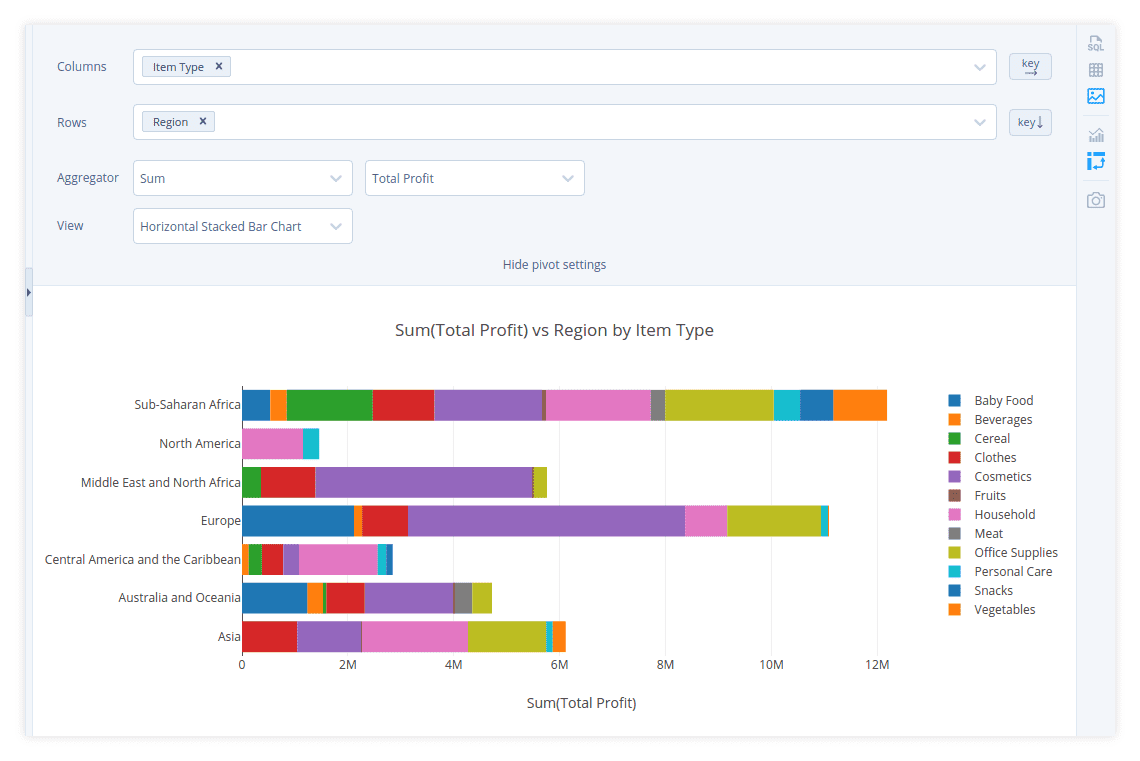
- View – pivot table visualisation. It can be a table, a heatmap, a chart, etc. See some examples of different views of the same pivot table below.


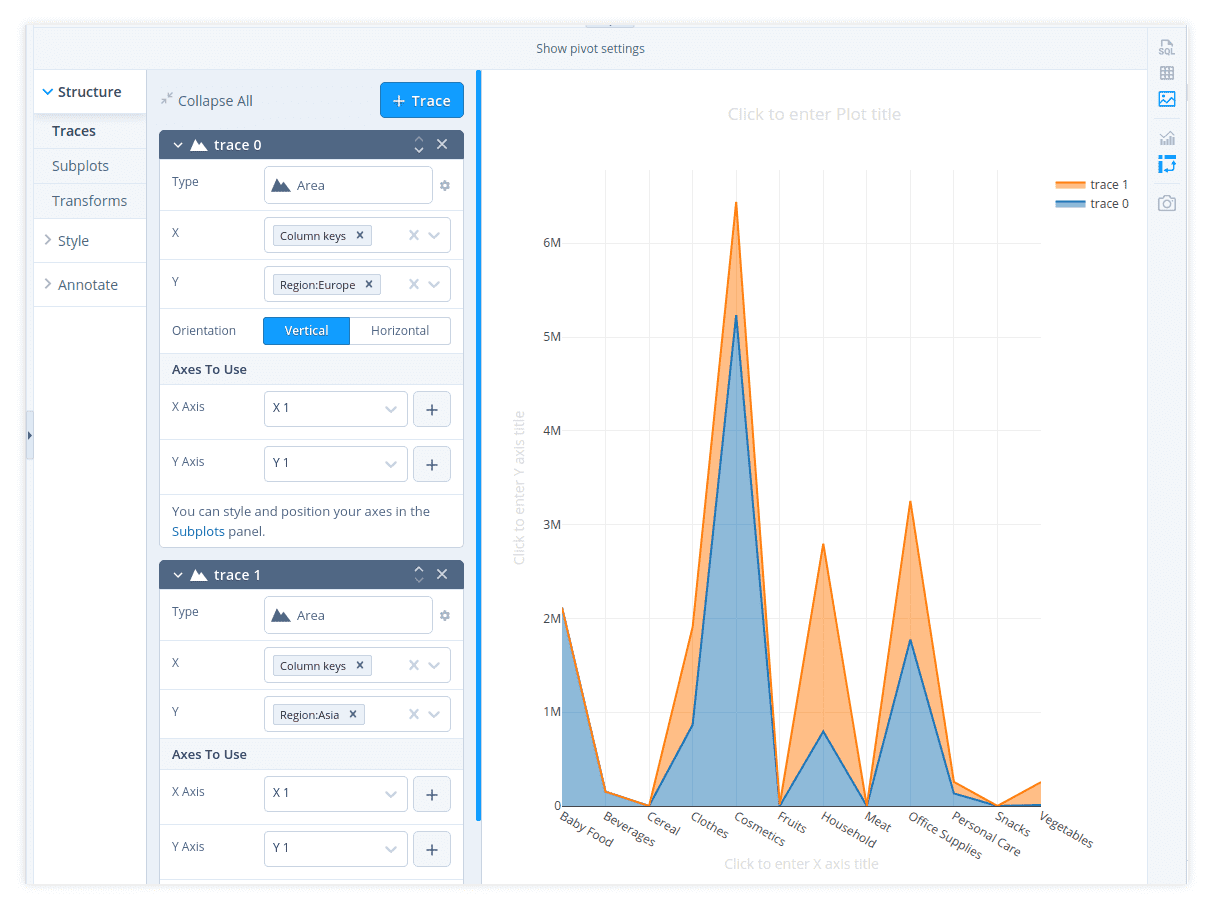
There are several built-in chart views for a pivot. But you can build your own
with Custom chart view (fig. 4).

Note: You can switch to other pivot views and back to
Custom chart– all your custom chart settings will be remembered. But if you switch the visualisation mode from pivot to any other mode, unsaved changes will be lost.
You can save any visualisation as an image by clicking .
Pivot table SQL
Pivot table (in the form of a result set) can be built on the SQL-level and, technically speaking, can be visualised as any other result set. Practically though there are a couple of challenges with that:
- Visualising a dataset of long/tall shape is much more convenient in Plotly (chart editor) rather than one of wide/fat shape.
- SQLite doesn't have a special constructs like
PIVOTorCROSSTABin its SQL dialect.
How to build a pivot table in SQL(ite) explores two options with static (or beforehand-known) and dynamic columns.
